A budget is your plan for the year: how much you expect each income account to earn and each expense account to cost, broken down by fiscal month. Once a budget is in place, you can compare it to your actual numbers at any time to see where you are ahead, behind, or right on plan. The examples below use our sample business, Demo Company Inc.
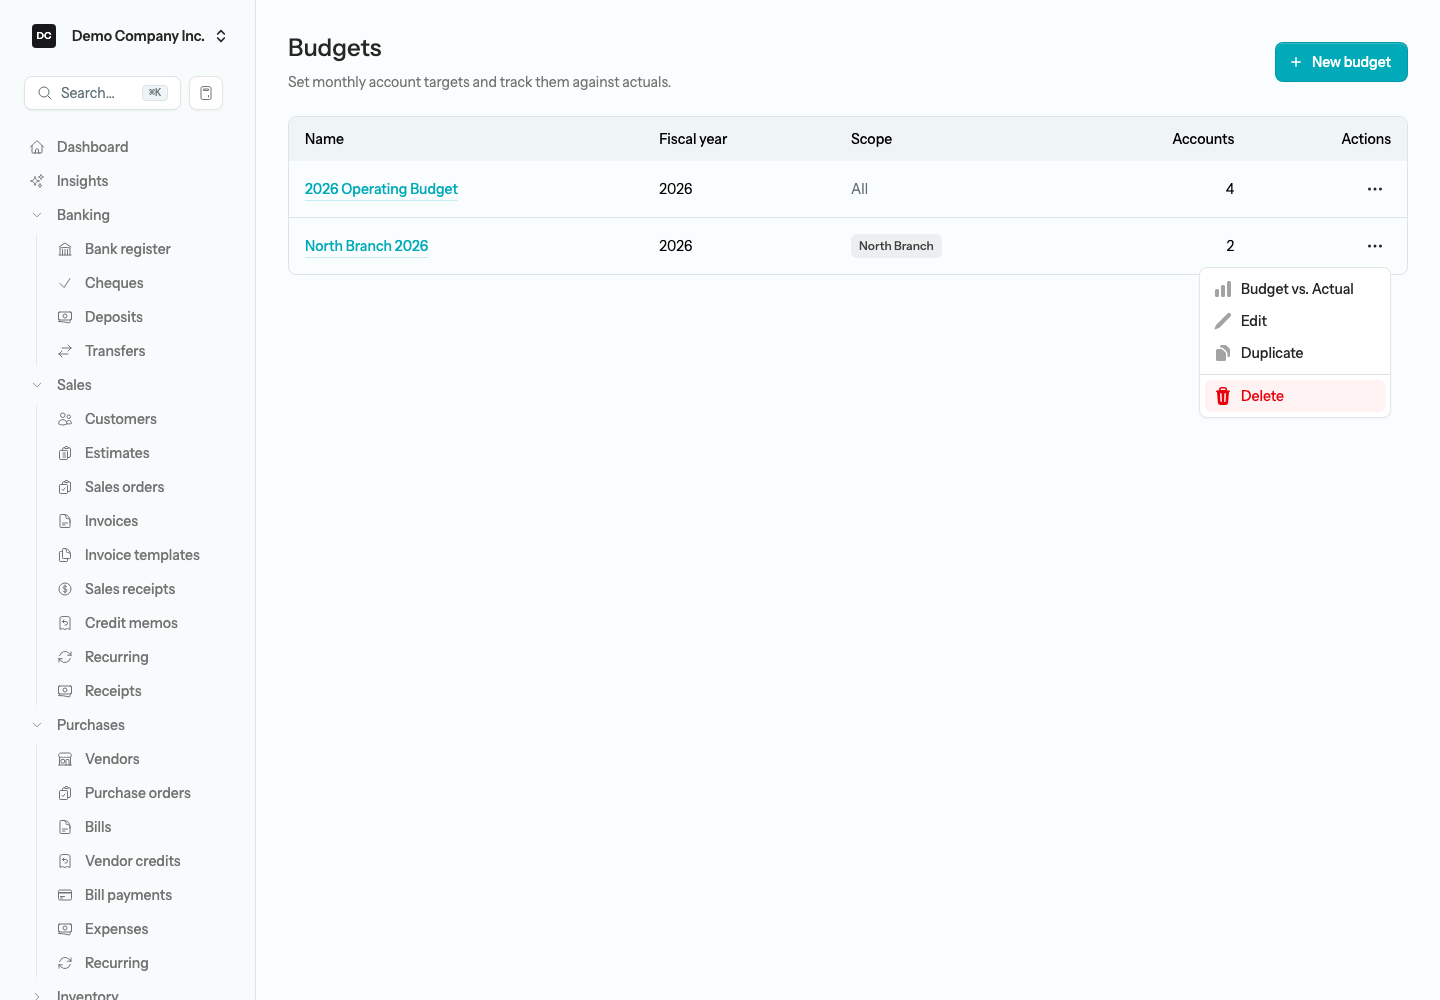
Open Budgets from the Reports group in the sidebar, next to All Reports. Each budget covers one fiscal year and holds twelve monthly amounts for every account you choose to plan against. You can keep as many budgets as you like — one per fiscal year, or several what-if versions for the same year. The list shows each budget’s Name, Fiscal year, Scope (the class or location it is limited to, or All), and how many Accounts it plans for. Select a name to open the budget for editing, or use the row’s Actions menu for Budget vs. Actual, Edit, Duplicate, and Delete.
Show or hide Budgets
Budgets is an optional feature, and it starts off for an organization created with the setup wizard, so there is no Budgets link in the sidebar until you turn it on. Turn it on at the wizard’s Features step (under Planning & Accounting), or later in the organization’s Features section; the link then appears in the Reports group of the sidebar. If your organization does not budget, leave it off; you can switch it on or off again whenever you like. Hiding the feature never deletes any budgets you have already saved.
To show or hide Budgets:
- Open Settings from the account menu at the bottom of the sidebar, choose Organizations, and open your organization.
- Scroll to the Features section and turn Budgets on or off.
- Select Save. The Budgets link appears or disappears in the Reports group of the sidebar.
Turning the feature off hides only the sidebar link. Your saved budgets stay in place, and the three budget reports remain listed on the All Reports page under Company & Financial, so anyone who opens one still sees the budgets you saved.
Create a budget
A budget is a grid of accounts down the side and fiscal months across the top. Each cell is the amount you expect for that account in that month. Only income and expense accounts can be budgeted — balance-sheet accounts are not on the list. The Account picker offers your active income and expense accounts; an account that is already on the budget stays selectable even if you have since made it inactive, so editing an older budget never silently drops a row.
To create a budget:
- Open Budgets from the Reports group in the sidebar, then select New budget.
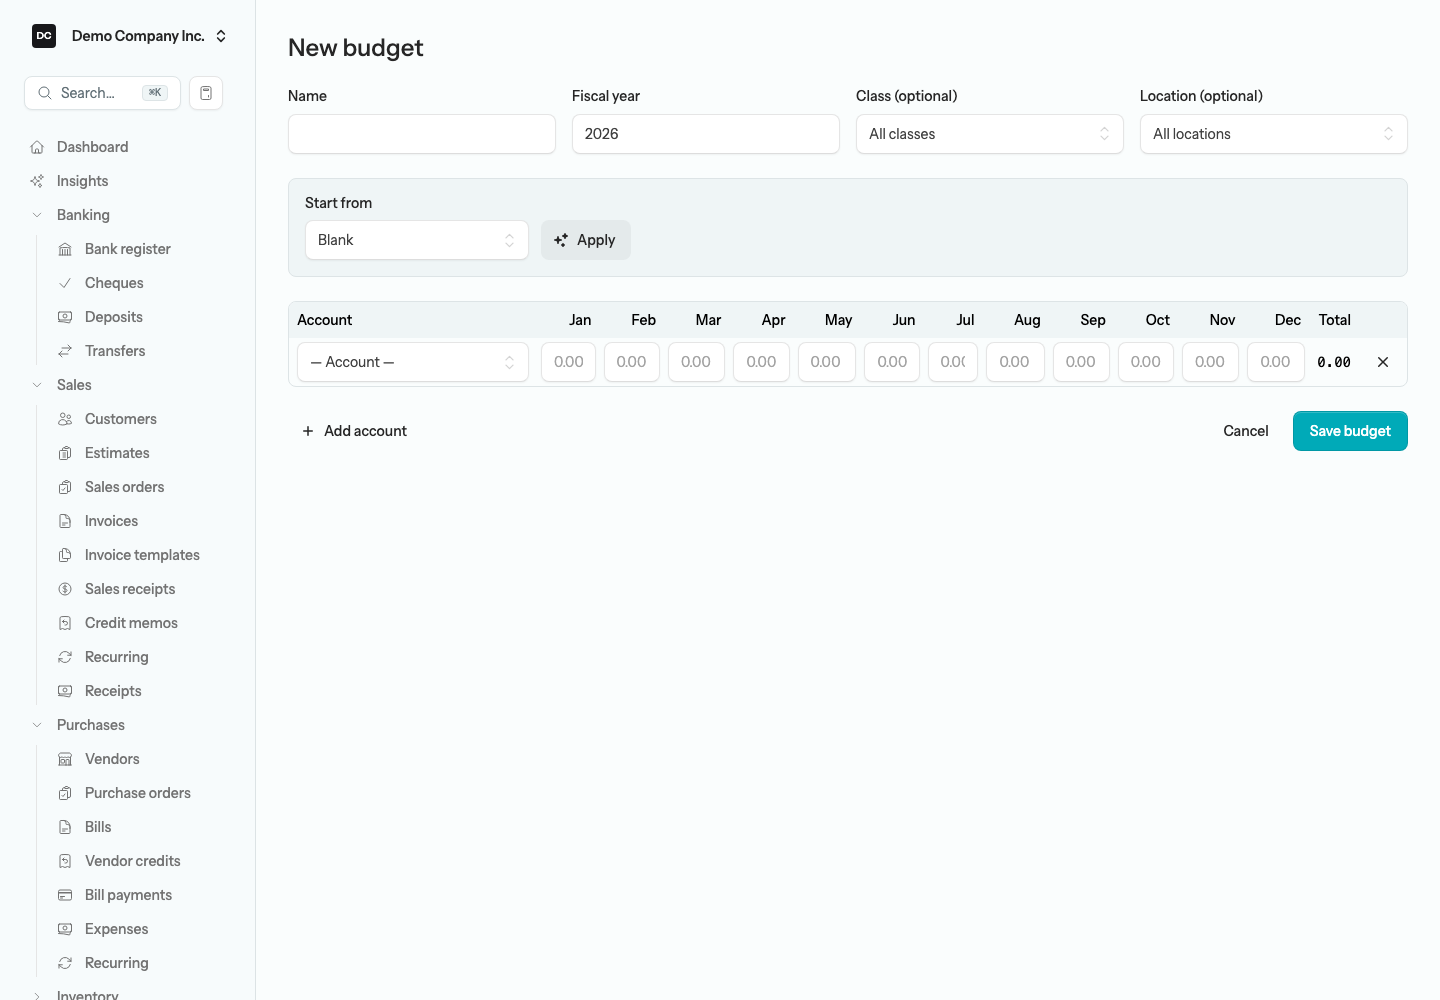
- Enter a Name and set the Fiscal year. It starts on the current fiscal year, and it is the calendar year your fiscal year begins in — the month columns follow your fiscal-year start month, so a July start makes the first column Jul.
- Optionally limit the budget to one division or site under Class (optional) or Location (optional). Leave them on All classes and All locations for an organization-wide budget.
- Choose how to start under Start from: Blank for an empty grid, Prior-year actuals to fill each cell with what the same month actually looked like in the previous fiscal year, or Copy existing budget and pick the Budget to copy. Select Apply. This box only appears on a new budget.
- For each row, pick an Account, then type the planned amount for each of the twelve months. Leave a month blank to mean zero; the Total column updates as you type.
- Select Add account to add another row. Use the X at the end of a row to remove it.
- Select Save budget. You return to the Budgets list with a “Budget saved.” confirmation.
Tip. Seeding from Prior-year actuals is the fastest way to start. Apply the seed, then tweak the months where you expect this year to look different — a price increase, a new hire, a one-off project. It is much faster than typing every cell from scratch. The seed only fills accounts that actually had activity last year, so empty rows do not clutter the grid, and it respects the class or location chosen above it, so a budget for North Branch is seeded from North Branch’s actuals only. Change the Fiscal year or scope and select Apply again to re-seed — this replaces every row in the grid.
Note — A few rules the form enforces. An account can appear on only one row, and at least one account must be budgeted before you can save. Rows with no account chosen are ignored, and a row where every month is zero carries no information, so it is dropped on save — that lets you leave blank rows in the grid without saving noise. Every month cell is also a quick calculator: type an expression such as 9000/12 to spread an annual figure evenly, or 1200*1.05 to add five percent, and a tape shows each step. Press Enter or click away to commit the result. It handles + − × ÷ with the usual precedence.

Note. Budgets are a planning tool. They do not post to the general ledger and they never affect your reports outside the Budget reports — your actuals stay completely untouched. They are also not included in an organization backup, so a restored organization comes back without its budgets; plan to re-enter or re-seed them after a restore.
Note — One person edits a budget at a time. Opening a budget for editing holds it until you save or leave. A teammate who opens the same budget sees who is editing instead of the grid, with Try again and — for Owners and Admins — Take over editing. Deleting a budget from the list is refused while someone else has it open. See Settings → Edit locks for how a lock is held and released.
Compare budget to actual
Once a budget is saved, three reports use it to show how you are tracking. Find them on the All Reports page under Company & Financial, or open Budget vs. Actual straight from the Actions menu on a budget row — that link opens the report with the row’s budget already selected. On the All Reports page, star any of the three to pin it to your sidebar. If your organization has no budget yet, each report shows a No budget selected notice with a link to create one.
To run Budget vs. Actual:
- Open All Reports from the Reports group in the sidebar, then select Budget vs. Actual.
- Choose the Budget to compare, then set the Period — it starts on This Fiscal Year-to-date — or pick your own Start and End dates; a click anywhere in a date field opens the calendar. Budget months whose first day falls inside the range are included, so any window — a month, a quarter, or year-to-date — lines up against the matching slice of the plan.
- If your organization tracks classes or locations, use the Class and Location filters to narrow the actuals to one division or site. A budget that is itself limited to a class or location automatically filters the actuals to that same slice while the filters stay on All classes and All locations.
- Read across each row: Actual is what your books say, Budget is what you planned, Variance is the difference, and % is the variance as a share of the budgeted amount. Favourable variances show in green, unfavourable in red — for income, higher actuals are favourable; for expenses, lower actuals are favourable.
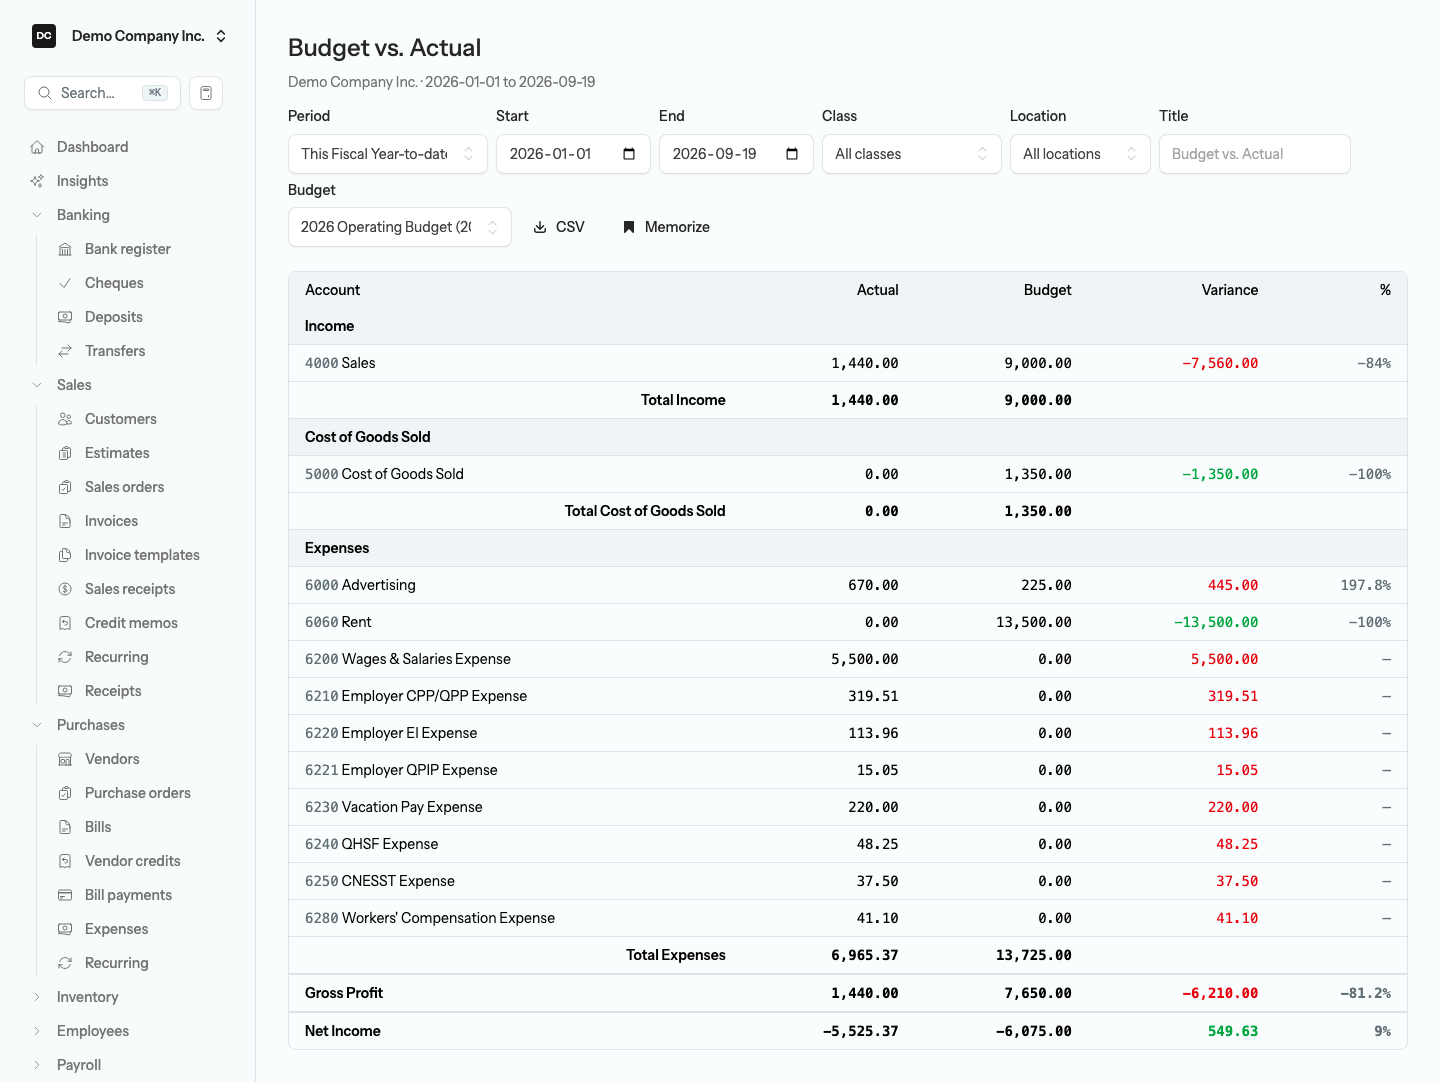
The report is laid out like an income statement: accounts are grouped into Income, Cost of Goods Sold, and Expenses, each section is totalled, and Gross Profit and Net Income lines summarize the whole plan against reality. Rows where both the actual and the budget are zero are hidden to keep the report tight. Select CSV to download the comparison. Use the Title field to rename the report, and Memorize to save this view — a memorized view keeps your dates, filters, and title, but not the budget itself, so check the Budget selector when you reopen it. See Reports for how memorized reports and favourites work.
Heads up — Filters replace a budget’s own scope. A Class or Location filter you pick replaces the budget’s own scope on the actuals side only — the Budget column always shows the amounts as you entered them. Filtering a budget limited to Main Chapel by North Branch therefore compares North Branch actuals against Main Chapel targets, and nothing on the report flags it. On a scoped budget, leave the filters on All classes and All locations, or filter by the same class or location the budget was built for.
The two companion reports
Two more reports give you different angles on the same numbers, each with a Budget selector at the top.
- Budget Overview lays the chosen budget out as a twelve-month grid — one row per account, the planned amount in each fiscal month, a row total, plus a Total row with column totals and a grand total. It shows the plan itself, with no actuals, and it has no date range, filters, or download buttons of its own — it is the view to read when you just want to see what is on the budget, and your browser’s Print command gives you a paper copy.
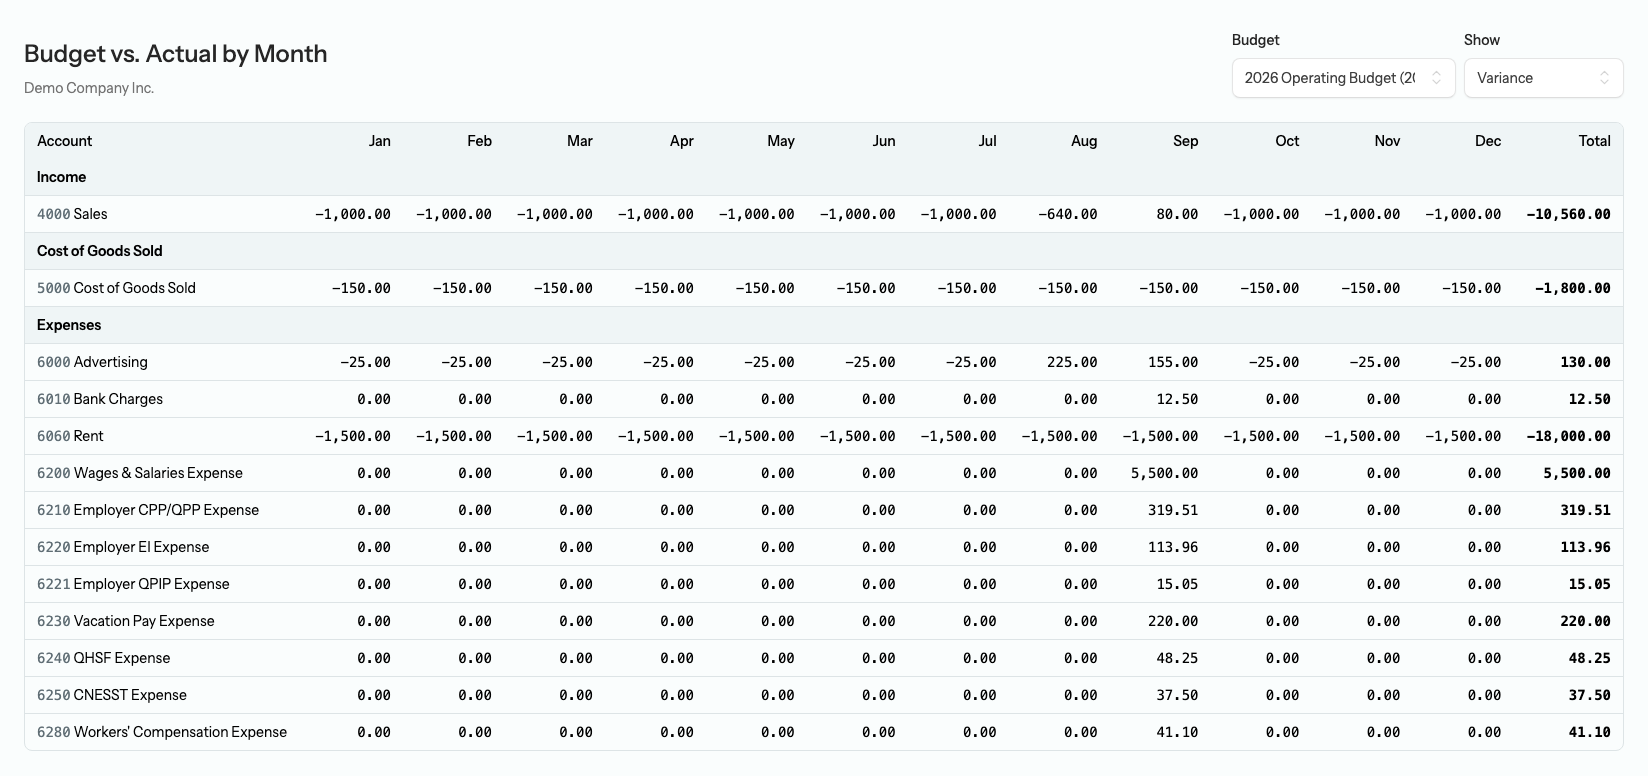
- Budget vs. Actual by Month is the same twelve-column grid, but every cell compares against your books. Use the Show selector to switch the whole grid between Variance, Actual, and Budget, so you can spot the month a line drifted off plan. There is no date range or Class and Location filter here: the grid always covers the budget’s twelve fiscal months and uses the budget’s own class or location scope, so a budget limited to North Branch is compared only with North Branch’s actuals. Rows with no budget and no activity all year are hidden.
Tip. Keep a budget per fiscal year so you build up history. To start next year, choose Duplicate from the Actions menu on last year’s budget: the copy is named “… (copy)”, keeps the same fiscal year and scope, and opens straight in the edit form — rename it, move the Fiscal year forward, and adjust the months where the plan changes. Or create the new budget with Start from set to Copy existing budget.
Heads up. Budgets never post to the ledger, so the period lock on closed months does not apply to them — a saved budget can be edited at any time, however far back it reaches. That is handy, but it also means a budget can quietly drift to match your actuals. Once the year is under way, treat a saved budget as a fixed plan and resist editing it, so the variance you see really is what changed.
Note — Budgets and your chart of accounts. A budget holds one row per account, so two accounts cannot be merged while both have lines in the same budget — the merge is refused and names the budgets involved. Remove one account’s row from those budgets first, then merge. See Accounting → Merge two accounts into one.
Reports tied to this area
- Budget vs. Actual — actual, budget, variance, and percentage for the date range you choose, grouped like an income statement, with Class and Location filters and a CSV export.
- Budget Overview — the twelve-month grid of a saved budget, with row, column, and grand totals, ready to read.
- Budget vs. Actual by Month — a twelve-month grid that shows variance, actual, or budget per fiscal month for every account, using the budget’s own scope.