Every report in LineLedger reads directly from your posted journal entries. Nothing is hand-calculated and there is no overnight rebuild — whatever you see reflects every transaction posted up to the moment you opened the page. Pick a date and the report recalculates against the ledger on the spot. The examples below use our sample business, Demo Company Inc.
Finding a report
The Reports hub is where you browse and open your reports. Open it from Reports → All Reports in the sidebar. Reports are grouped the way you think about your business — Company & Financial, Customers & Receivables, Vendors & Payables, Sales, Purchases, Sales Tax, Accountant & Taxes, Lists, and Combined / Multi-company — so you can scan to the area you need. Five more groups appear only when they apply to you: Non-profit for non-profits, clubs, and charities; Inventory once you turn inventory on; Employees & Payroll once payroll is turned on and your role includes the Payroll section; and Membership and Fundraising once you turn those features on. A few reports have no card on the hub because they always open for something specific: the Transactions report opens from an account link on a financial statement or a customer or vendor name on Sales by Customer and Purchases by Vendor, a contact statement opens for one customer or vendor, and a sales rep’s own report opens from Sales by Rep.
To open a report:
- Select Reports → All Reports in the sidebar.
- Browse to the group you want, or type into the Search reports… box at the top-right. The search matches each report’s name and its description, so typing “overdue” finds AR Aging and AP Aging.
- Select the report card to open it.
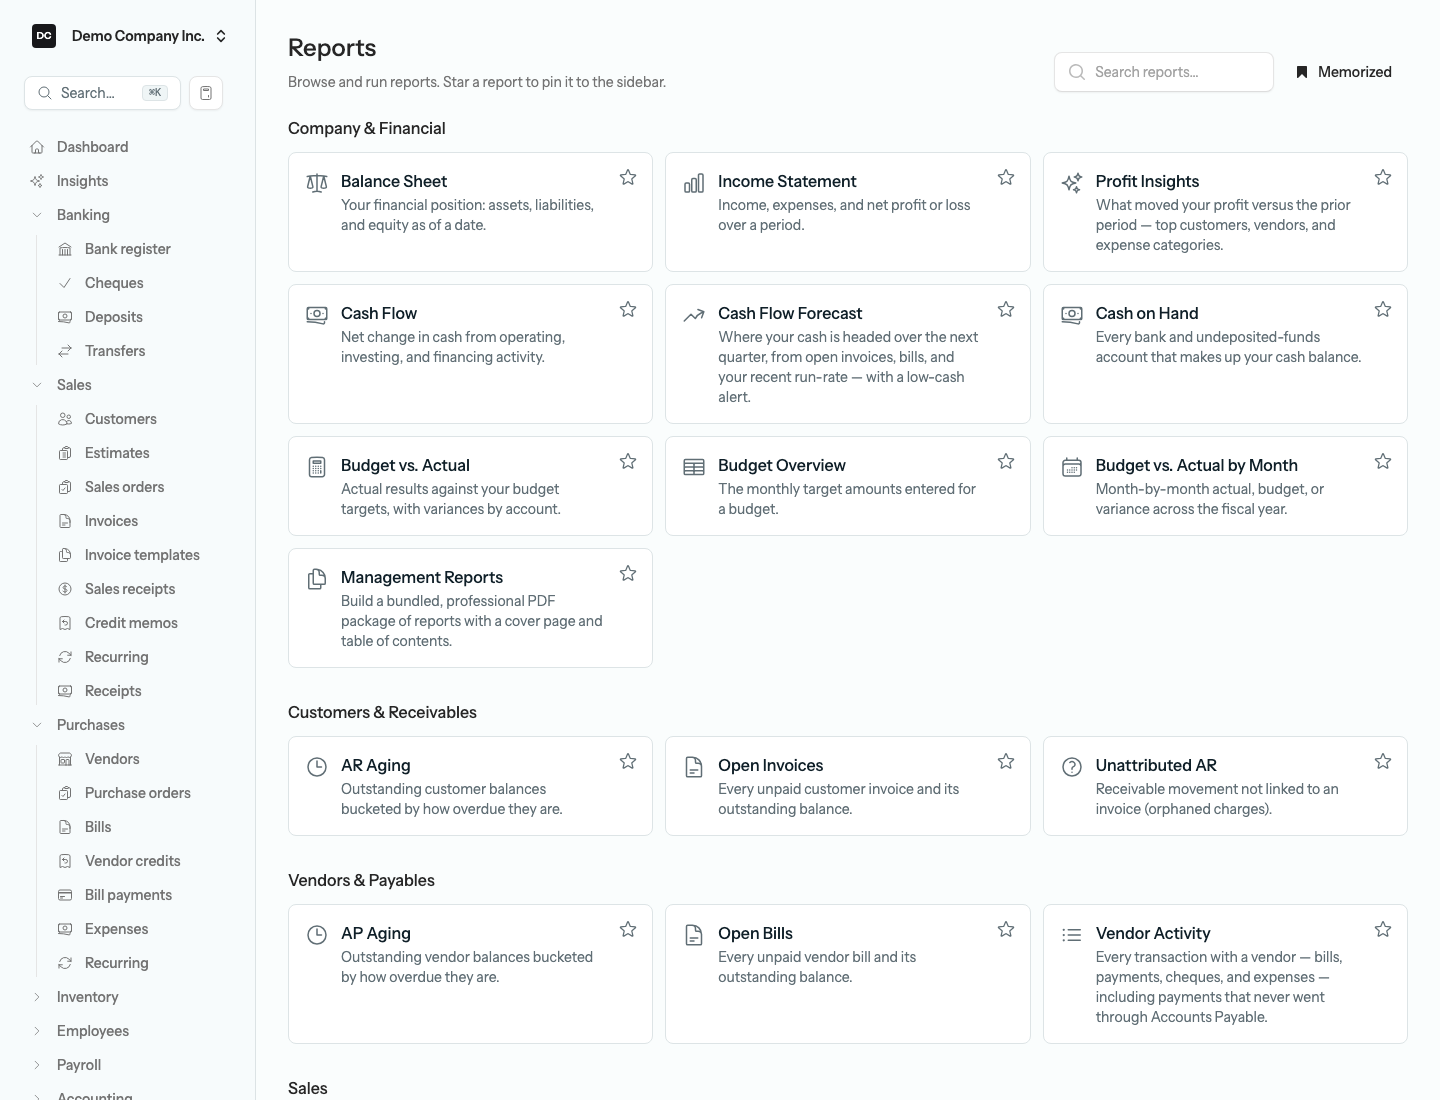
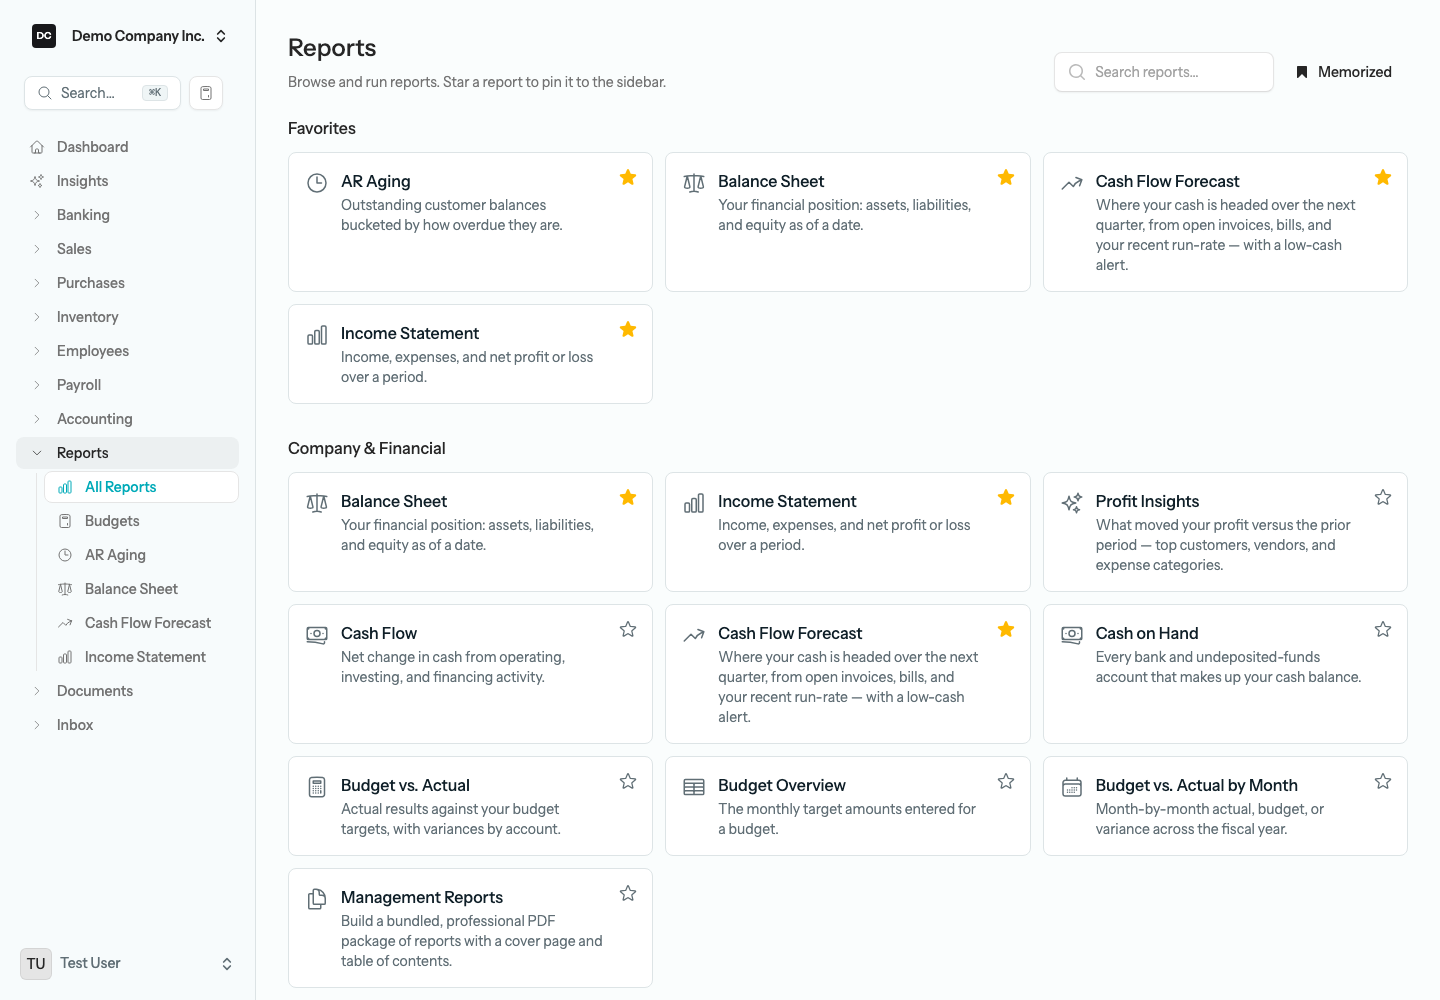
Tip — Pin reports to Favorites for one-click access. On the Reports hub, select the star on any report card to pin it. Pinned reports gather under a Favorites heading at the top of the hub, and appear as shortcuts in the Reports group in the sidebar — which otherwise stays compact with just All Reports and Budgets. Select the star again to unpin. Pin the three or four statements your team runs every week and you will rarely need to open the hub.
Reading a financial statement
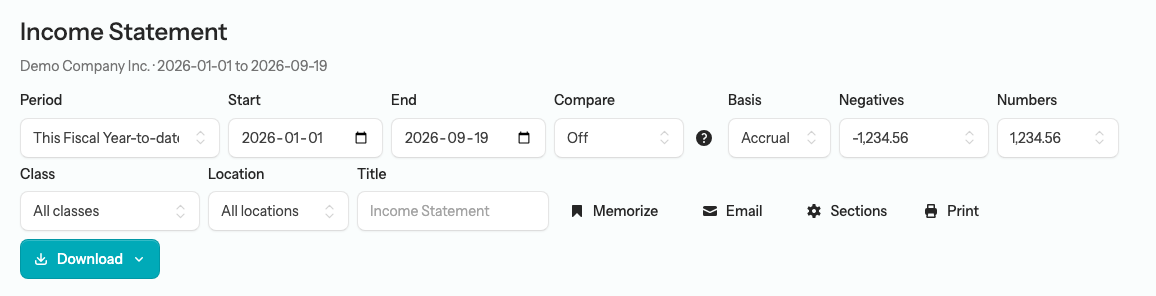
Most reports share the same control bar across the top, so once you learn one you know them all. Not every report shows every control — a report only offers the ones that make sense for it — but they always work the same way:
- Period — a quick picker for common ranges like This Fiscal Year-to-date, This Month, or Last Fiscal Quarter. Choosing Custom lets you set the dates by hand. Activity reports (Income Statement, Cash Flow, Transactions) take a Start and End date; point-in-time reports (Balance Sheet, aging, Trial Balance, Cash on Hand) take a single As of date. A click anywhere in a date field opens the calendar.
- Compare — Off, Prior period, or Prior year. Picking either adds a side-by-side column, and the report subtitle prints both date ranges so every export is explicit. Prior period is the immediately preceding range of the same length (last month beside this month); Prior year is the same dates one calendar year earlier. The question-mark beside the control repeats this explanation. Offered on the Balance Sheet, Income Statement, Cash Flow Statement, Profit Insights, Sales by Customer, Sales by Item, Sales by Rep (and the Accounts only view of a rep’s own report), Purchases by Vendor, Purchases by Item, and, for non-profits, the Statement of Financial Position and Statement of Operations.
- Basis — Accrual or Cash, on the Income Statement only. See Accrual or cash basis below.
- Negatives and Numbers — how figures print on the four core statements. Negatives offers -1,234.56, (1,234.56), or -1,234.56 in red. Numbers shows cents (1,234.56), whole dollars (1,235), or thousands; choosing thousands stamps “$ in thousands” into the subtitle. These only change the display — totals are still computed to the cent, and Excel exports keep full precision.
- Class and Location — appear once you track classes or locations, so you can narrow a report to one part of the business. Leave them on All classes and All locations to include everything.
- Title — type your own heading here and it prints on the report and its exports; leave it blank to use the default.
- Columns — on list-style reports (Transactions, aging, Open Invoices, Sales by …, Purchases by …), a dropdown of optional columns you can tick on and off.
- Memorize — save the report with its current settings so you can reopen it later in one click. Every control also writes itself into the page address, so a bookmarked or shared link reopens the report with the same dates, filters, and columns.
- Email — send the report as a PDF attachment, exactly as currently filtered.
- Sections — on the Balance Sheet, Income Statement, and Cash Flow Statement, define your own named sub-groups with subtotals (covered below).
- Print — opens a print-friendly PDF of the report in a new tab, matching the on-screen view.
- Download — export the report as CSV, Excel, or PDF from the dropdown.
Charts on the financial statements
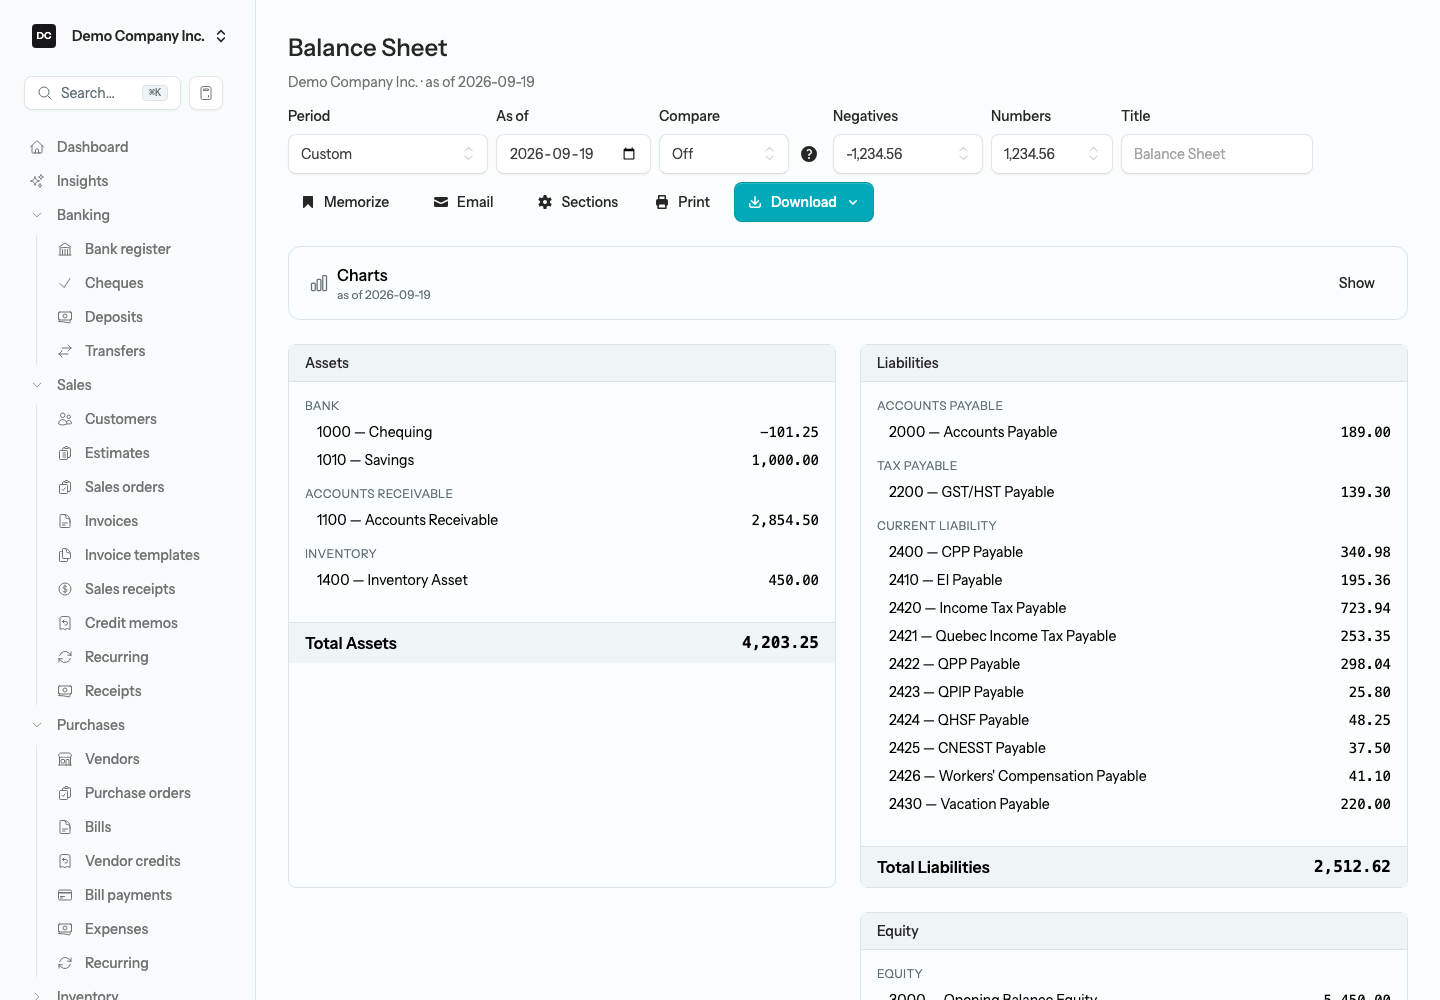
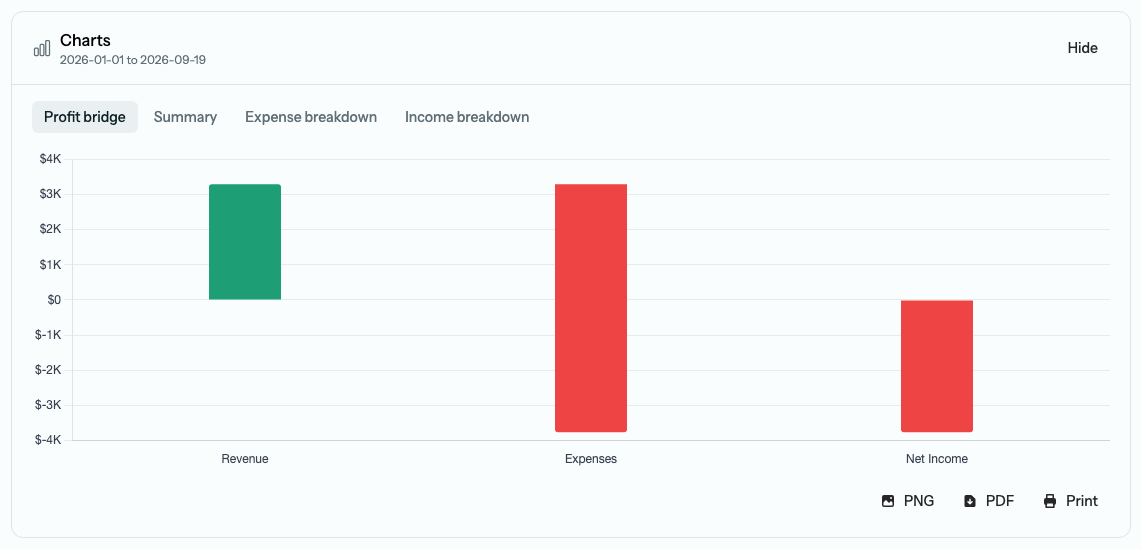
The Balance Sheet, Income Statement, and Cash Flow Statement each carry a chart panel that visualizes the same numbers you are reading. It sits at the top of the report, collapsed by default — select Show to open it, Hide to tuck it away. The charts always reflect the period and comparison you have set, and update the moment you change them. Use the tabs to switch between the views for that report, and PNG, PDF, or Print to take the chart with you. A view with nothing to show reads “No data to chart for this period.” The breakdown rings appear as soon as one category has an amount, except the Cash Flow Statement’s Operating drivers ring, which needs at least two operating items to compare — pick a wider date range if a chart looks empty.
- Balance Sheet — Assets = Liabilities + Equity (the accounting equation as two stacked bars), Asset composition and Liabilities & equity breakdowns, and a Current vs prior comparison when a comparison column is on.
- Income Statement — a Profit bridge from revenue down to net income, a Summary bar, and Expense breakdown and Income breakdown rings of your biggest categories.
- Cash Flow Statement — a Cash bridge from opening to closing cash, an Activities bar of operating / investing / financing, and an Operating drivers breakdown.
The core financial statements
Five reports answer the questions every business owner and accountant asks — the Balance Sheet, Income Statement, and Cash Flow Statement in the Company & Financial group, and the Trial Balance and General Ledger in Accountant & Taxes.
Balance Sheet
The point-in-time snapshot of what the business owns, owes, and the residual equity. Assets always equal liabilities plus equity — if the report does not balance, something was posted incorrectly to the ledger. Net income for the year so far appears inside equity as “Net income (YTD)”. Set Compare to Prior period or Prior year to see last period-end or last year-end beside today.
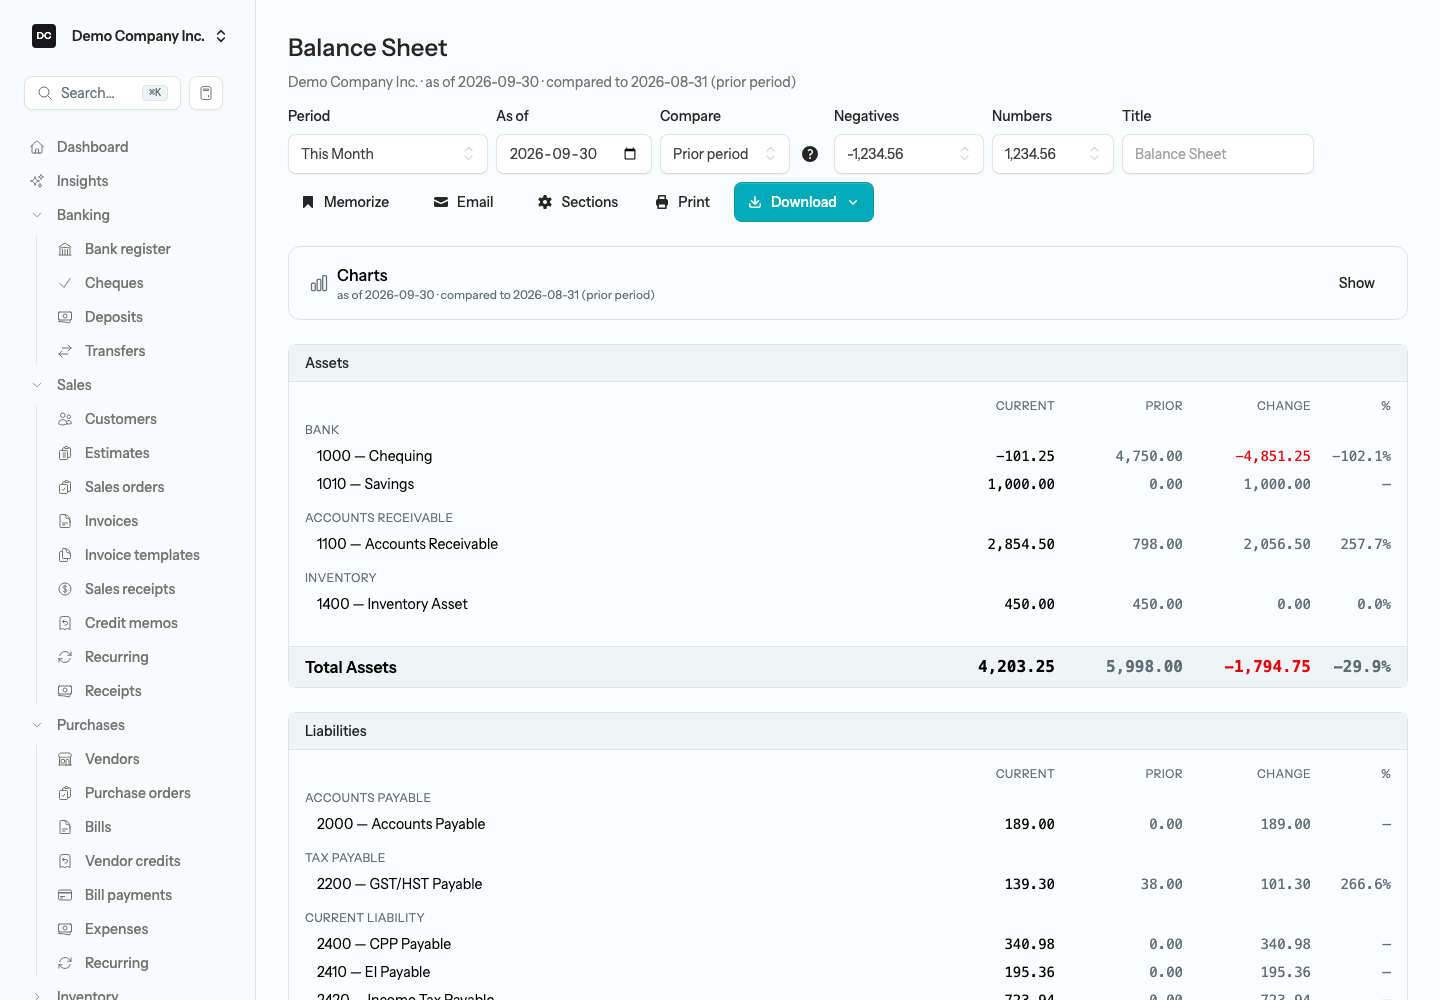
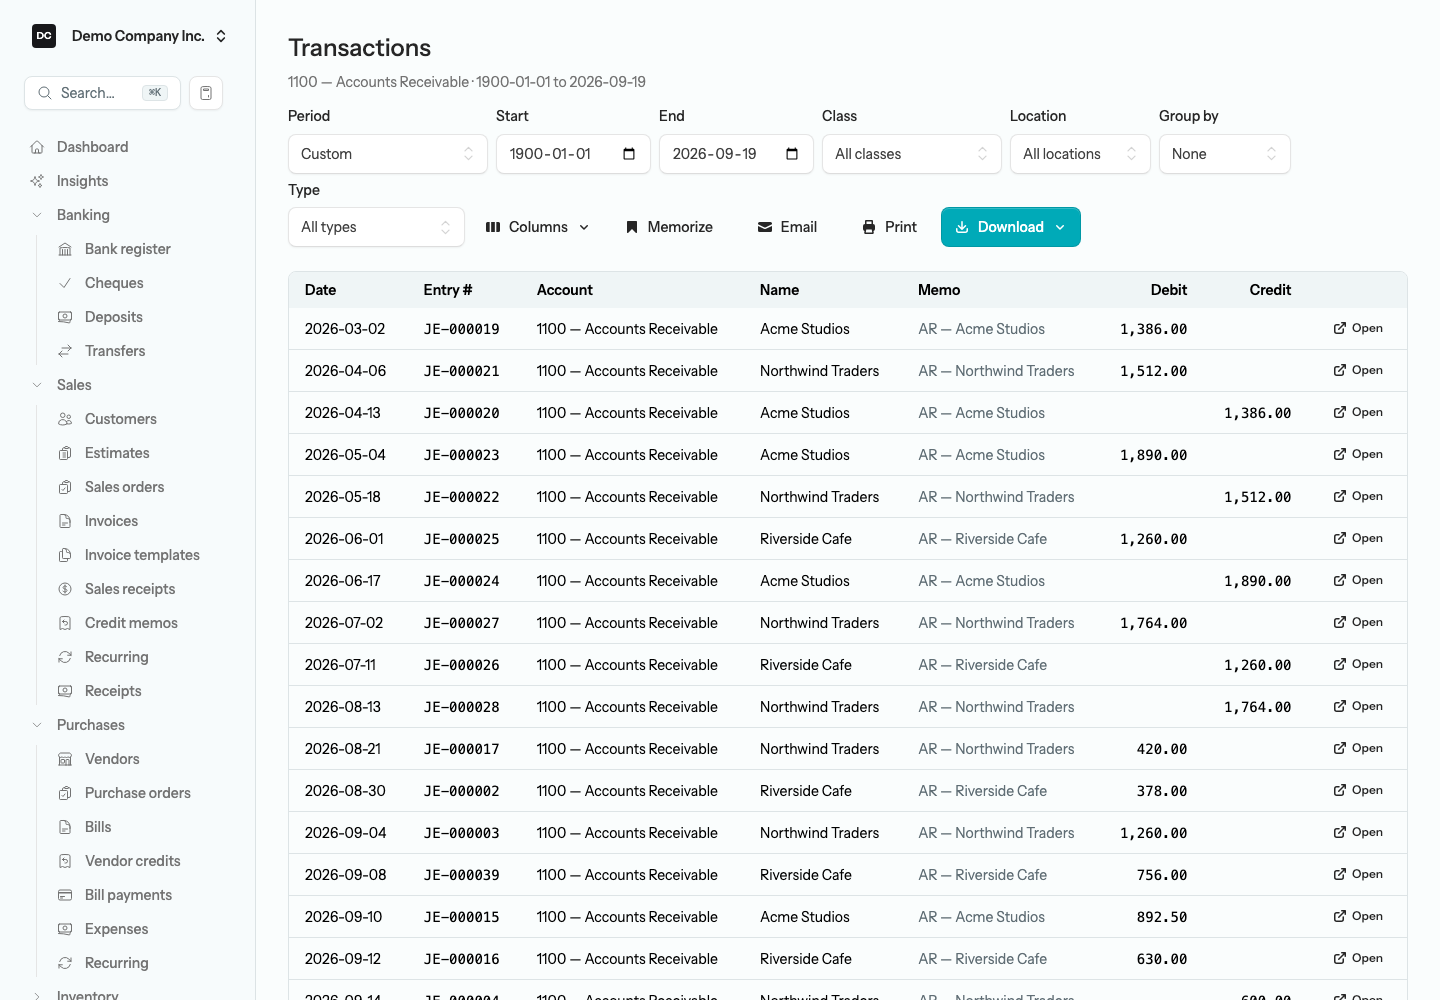
Tip — Drill from an account to its transactions. Account names on the Balance Sheet, Income Statement, and Cash Flow Statement are links. Select one to open the Transactions report scoped to that account so you can see the exact journal-entry lines behind the figure, and from there open any transaction in place. On the Income Statement and Cash Flow Statement the drill covers the same date range; on the Balance Sheet it runs from the beginning of your books to the As of date, because a balance is the sum of everything ever posted. On the Trial Balance, account names open the General Ledger for that account from the start of the fiscal year to the As of date.
Income Statement (Profit & Loss)
Revenue minus expenses over a date range — your profit or loss for the period. Use it to compare months, track gross margin, and see which expense categories are growing. Set a Start and End date, or narrow it to a single Class or Location with the filters in the control bar. Pick Compare → Prior period to set last month beside this month, or Prior year to compare this quarter against the same quarter last year.
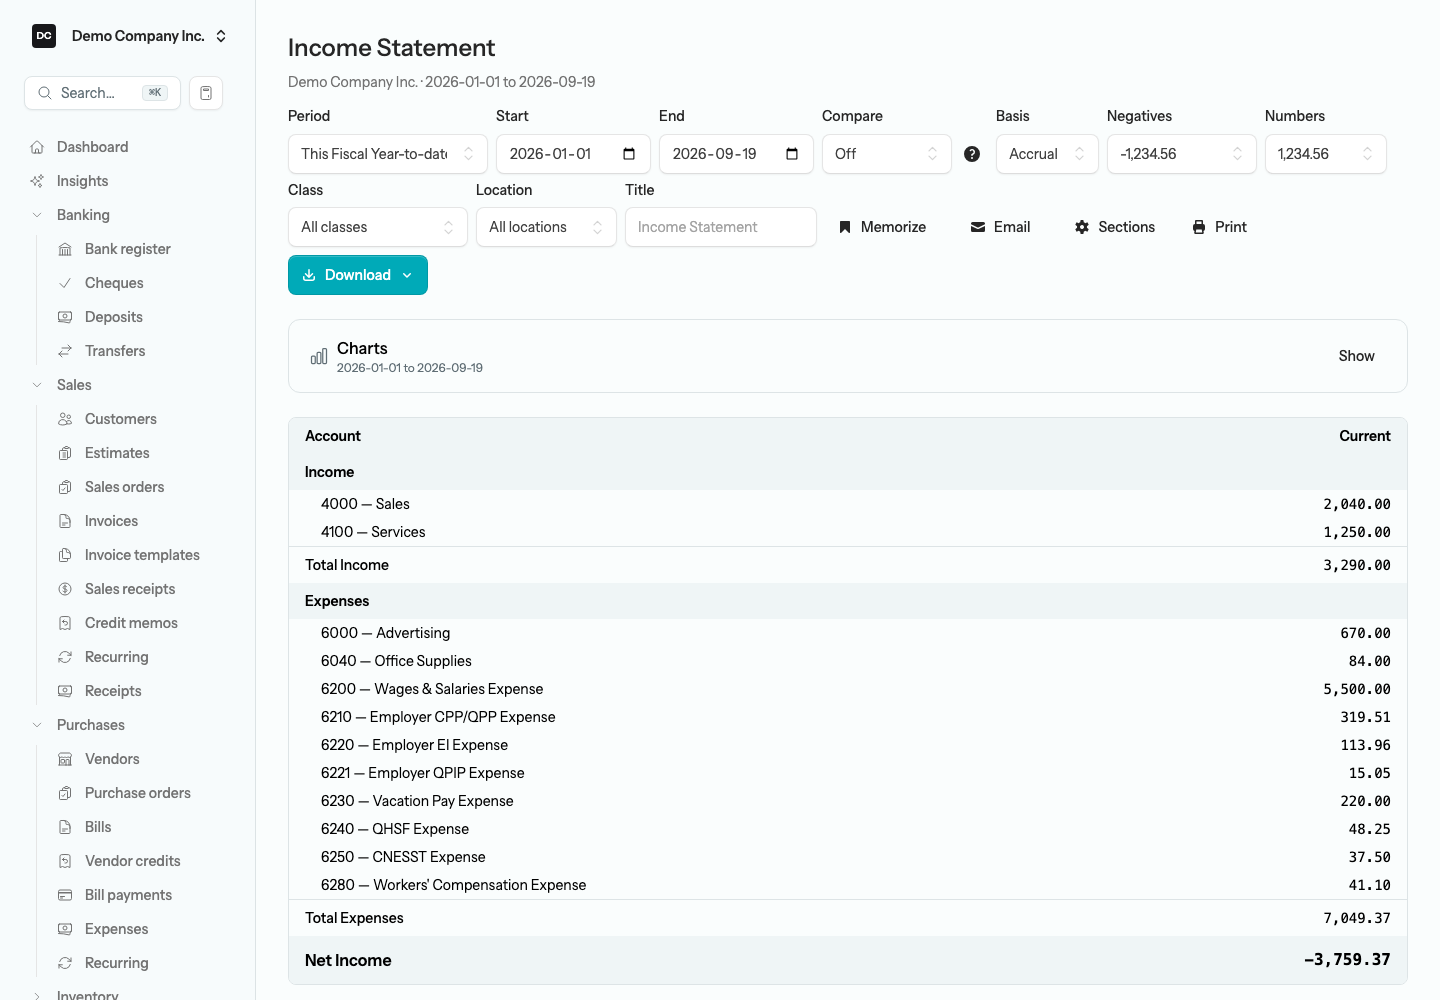
Tip — Accrual or cash basis. The Basis control switches the Income Statement between Accrual — the default, read straight from the ledger, where an invoice counts as revenue on the day you post it — and Cash, where revenue and expenses count only when the money actually moves, as a payment is applied to the invoice or bill. Cash basis stamps “Cash basis” into the subtitle and the export file name so the two views are never confused, and the setting is saved with a memorized report. Use Cash when your accountant files on a cash basis or you want to see what the period really collected and paid.
Cash Flow Statement
Where your cash came from and went over a period, split into operating, investing, and financing activities. It is built the indirect way — starting from net income and adjusting for the non-cash movements — entirely from the ledger, so it always reconciles the opening cash balance to the closing one. It carries the same Compare control and account drill-through as the other statements, and supports custom sections.
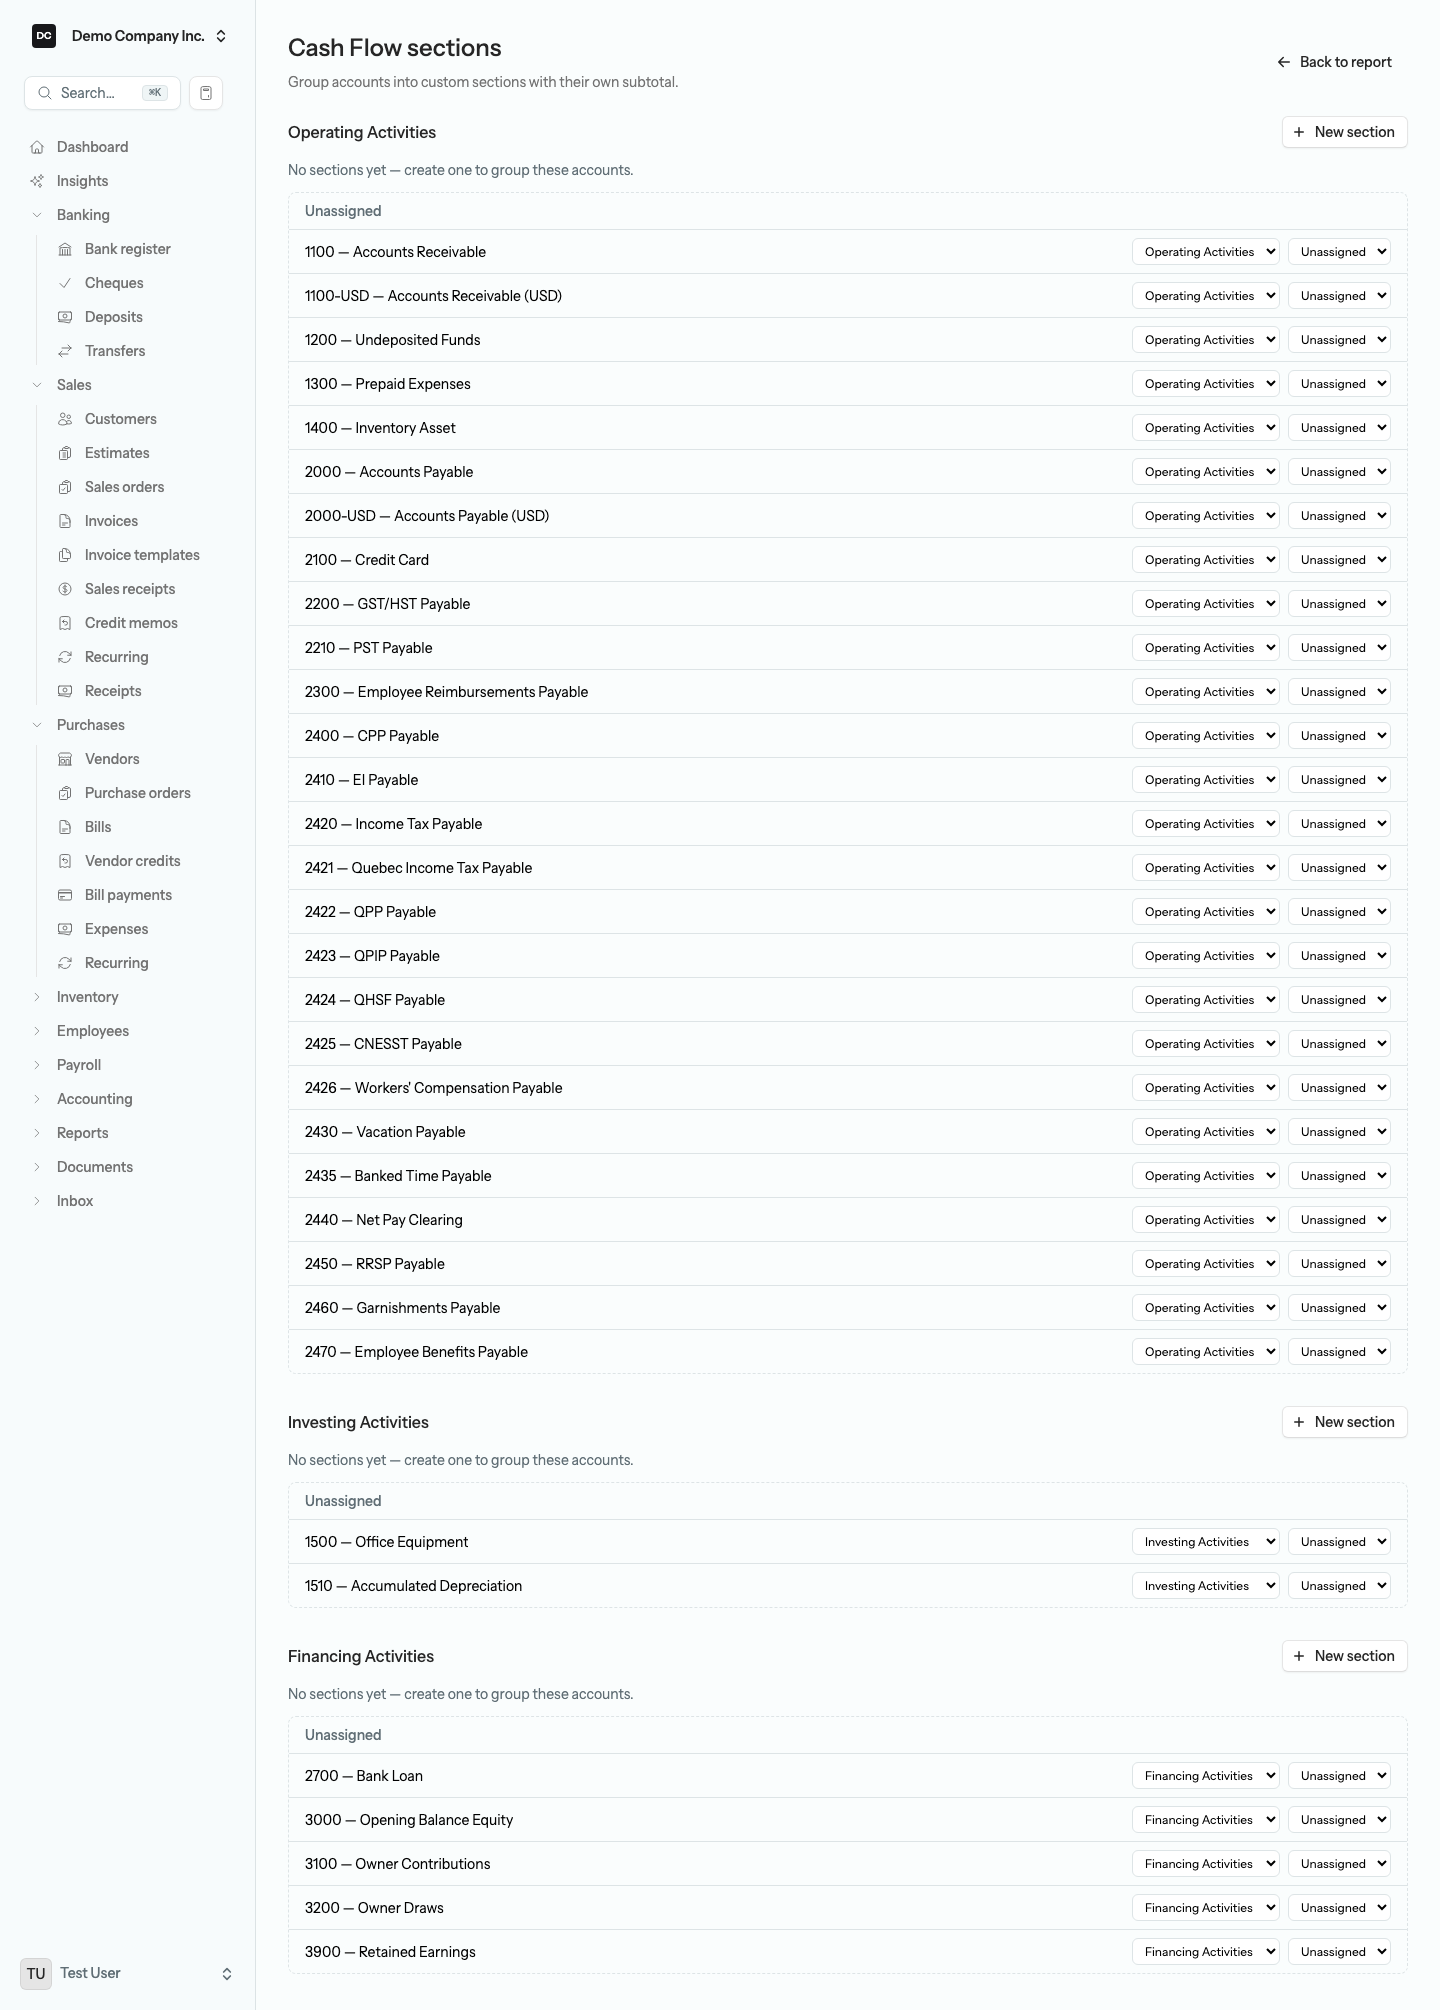
Note — Move an account to a different activity. Every balance-sheet account is classified into Operating, Investing, or Financing for the Cash Flow Statement by its account type, but you can override that per account. The control lives on the Cash Flow sections page: each account row carries an activity dropdown beside its section dropdown, and changing it takes effect immediately on every future run of the statement. Bank accounts and income-statement accounts are not listed — they have no activity to move. Combined report groups offer the same choice per combined line, from the group’s Cash Flow sections page or from the line’s edit dialog on the group’s edit page.
To move an account to a different cash-flow activity:
- Open Reports, run the Cash Flow Statement, and select Sections in the control bar.
- Find the account under Operating Activities, Investing Activities, or Financing Activities — in one of your sections or in the Unassigned list.
- In the first dropdown on its row, choose the new activity. The account moves there on the spot (and leaves any custom section it was in, since sections belong to an activity).
- Select Back to report. The statement now places the account under its new activity for every period.
Trial Balance
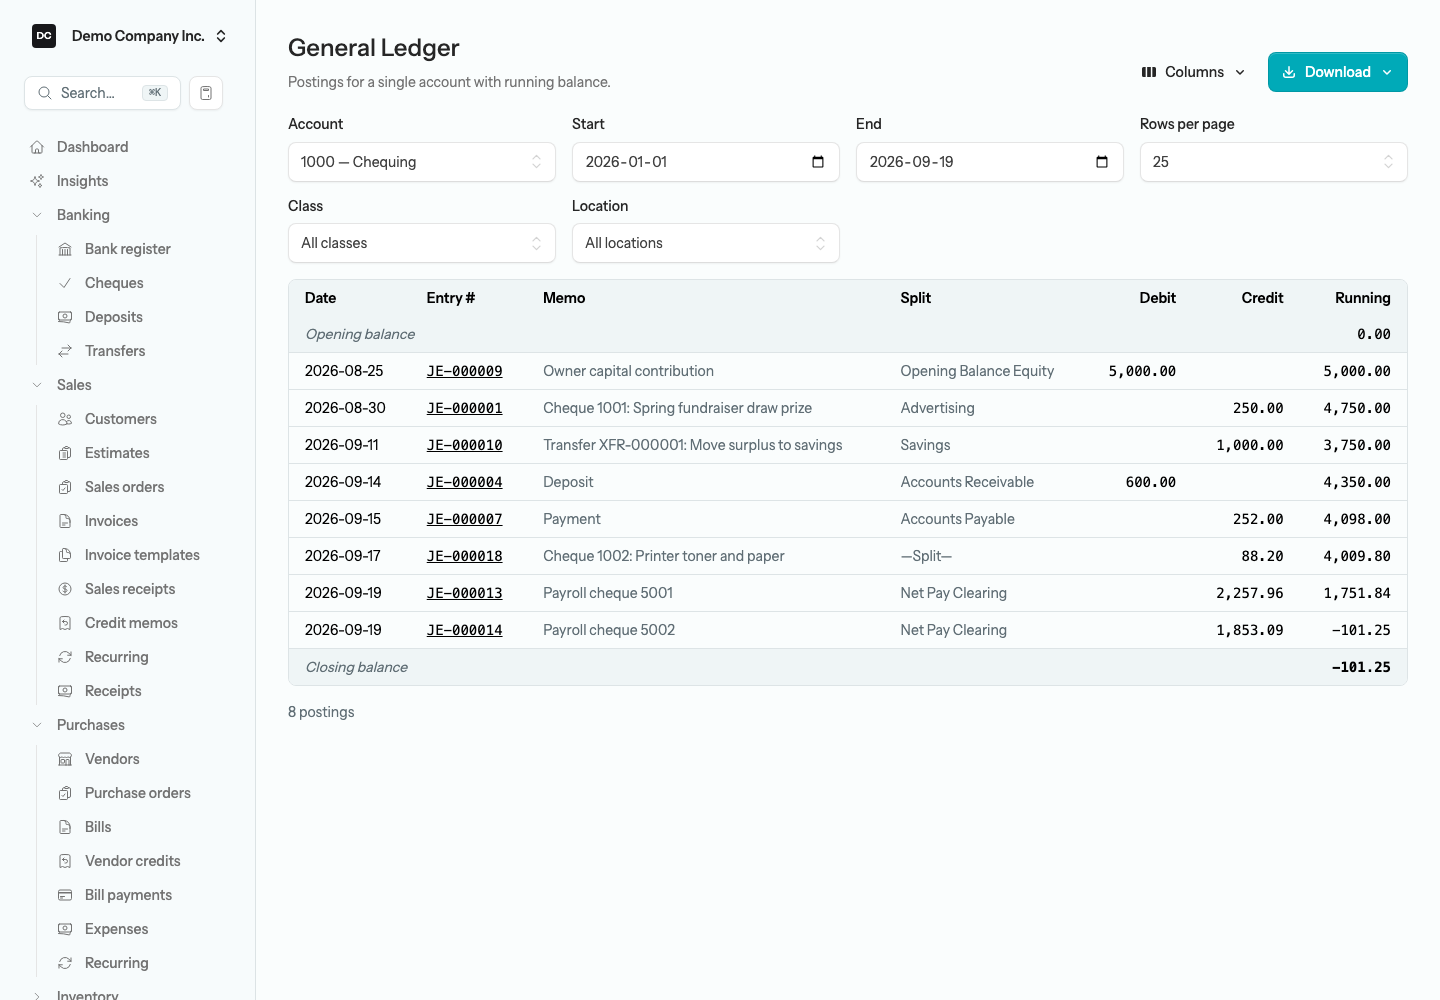
Every account with its debit or credit balance as of a chosen date. Total debits should equal total credits — the trial balance is the accountant’s first check that the books are internally consistent. Use the Type filter to show only one account type, and select an account to open its General Ledger for the fiscal year to date.
General Ledger
Every journal-entry line, in the order it was posted, so you can trace exactly how an account reached its current balance. It opens at the start of your fiscal year through today, so the opening balance shows what carried in and the postings explain how the current balance built up. Pick — All accounts — to see everything grouped by journal entry, or one account for a running balance with opening and closing figures and a Columns picker. On-screen results are paginated — set Rows per page — while exports always cover the full date range you set, not just the current page. The Chart of Accounts drills here too: an account’s code or name, or View ledger in its row menu, opens the General Ledger for that account.
The General Ledger exports to CSV and Excel. Both stream the dataset in chunks, so a multi-year range exports without loading everything into memory and a full-history pull will not time out. PDF is not offered here because the row counts are typically too large to render usefully — for a printable view, select the account on a financial statement to open the Transactions report, then set the same dates.
Note — Custom report sections. On the Balance Sheet, Income Statement, and Cash Flow Statement, the Sections button opens a page where you define your own named sub-groups, each with its own subtotal. Assign accounts to a section within their natural area (a current-asset section can only hold current-asset accounts, an income section only income accounts). Sections only regroup accounts and add subtotals — they never post entries or change the report totals.
Cash flow forecast
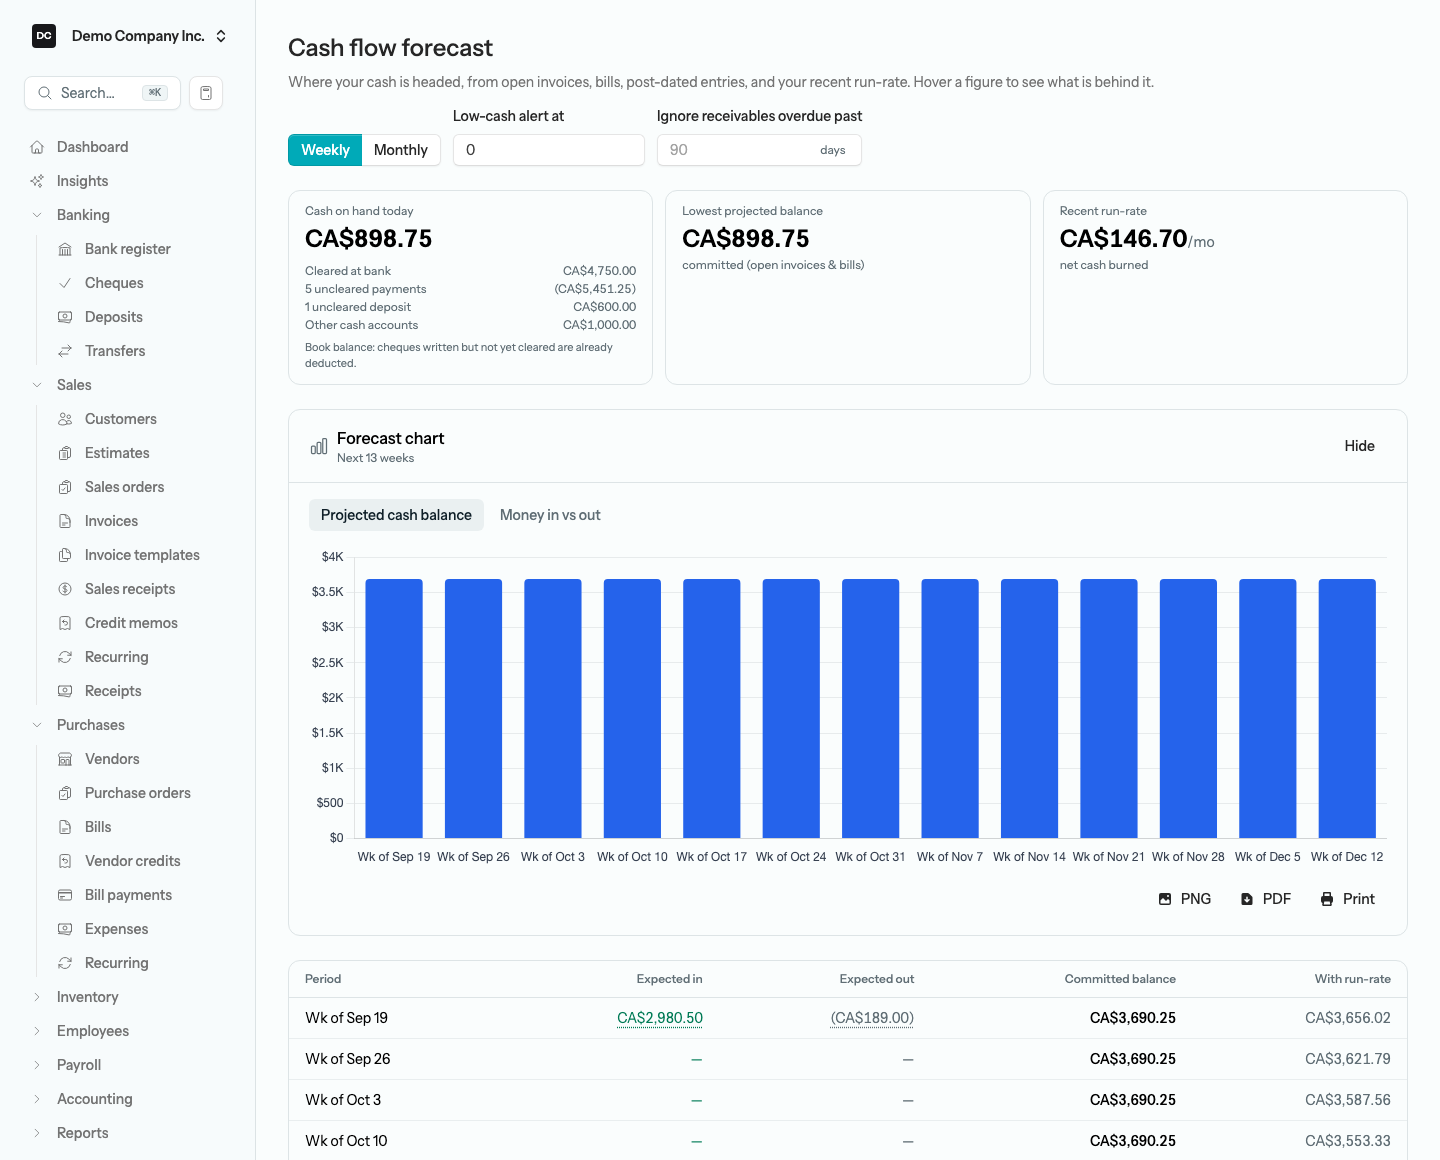
The reports above look backward at what already happened. The Cash Flow Forecast looks forward: it projects where your bank balance is headed over the coming weeks or months, so you can spot a cash crunch before it arrives. Open it from Reports → Company & Financial → Cash Flow Forecast. Like every report it reads live from your books — your open invoices, open bills, and recent operating run-rate — so the same data always produces the same projection. The forecast works on two tracks, so you can tell a near-certainty from an estimate:
- Committed — your book cash today (cheques you have written but that have not cleared are already deducted), plus each open invoice when it is realistically expected, minus each open bill on its due date, plus any post-dated entry already in the ledger — a post-dated cheque or a future-dated bank charge — on the date it is booked. Overdue invoices and bills are assumed to settle in the first period; invoices not yet due are pushed out by how late your customers typically pay, learned from the past year of receipts. A receivable overdue by more than the cut-off you set (90 days unless you change it) is left out and listed separately as doubtful. This is the high-confidence line, and it is the one that drives the low-cash alert.
- With run-rate — the committed line plus an estimate of ordinary day-to-day operations, taken from your net operating cash over the last 90 days. Because it already reflects recurring activity, it reads higher when the business has been generating cash and lower when it has been burning it.
To run the cash flow forecast:
- Open Reports and select Cash Flow Forecast from the Company & Financial group.
- Choose Weekly to project the next 13 weeks, or Monthly for the next 6 months.
- Optionally type a figure into Low-cash alert at — the balance you never want to drop below. If the committed balance is projected to fall under it, a banner names the date it happens.
- Optionally change Ignore receivables overdue past — how many days overdue an invoice can be before the forecast stops counting on it.
- Read the three summary cards — Cash on hand today, Lowest projected balance, and Recent run-rate — then scan the table period by period: the cash Expected in, the cash Expected out, the running Committed balance, and that same balance With run-rate. Hover any Expected in or Expected out figure to see exactly which invoices, bills, and post-dated entries make it up.
The Cash on hand today card also ties your book balance to the bank once you reconcile: it shows the balance cleared at the bank, the payments written but not yet cleared, and any deposits still in transit. That is why an outstanding cheque does not appear again as a future outflow — it has already left your book balance.
Heads up — An estimate, not a promise. The committed line only counts invoices and bills already on your books — it cannot know about a sale you have not invoiced yet — and the run-rate is a simple 90-day average, so a one-off month can skew it. Anything due past the end of the horizon is left out. Treat the forecast as an early-warning signal, then act on the specific invoices and bills behind it: collect an overdue invoice sooner, or push a bill’s due date out, and the forecast updates the moment you do.
More financial analysis
Profit Insights
Profit Insights explains what moved your bottom line between two periods, instead of just stating the number. Pick a period and it sets Revenue, Expenses, and Profit beside the prior period, then lists the customers, vendors, and expense categories that changed the most — so you can see in plain language why this month’s profit differs from last. It lives in the Company & Financial group. The daily insight cards on the dashboard are a separate feature — see Insights.
Cash on Hand
Every bank and undeposited-funds account that makes up your cash balance as of a date — Code, Account, Subtype, and Balance, with a total at the bottom. It is the quickest answer to “how much cash do we actually have?” without reading the whole Balance Sheet, and like the statements it can be memorized, emailed, and printed.
Budgets
Once you have entered a budget, three reports compare it against your actual results: Budget vs. Actual (totals with the variance per account), Budget Overview (the monthly target amounts you entered), and Budget vs. Actual by Month (the month-by-month picture across the fiscal year). See Budgets for how to build a budget in the first place.
Management report packages
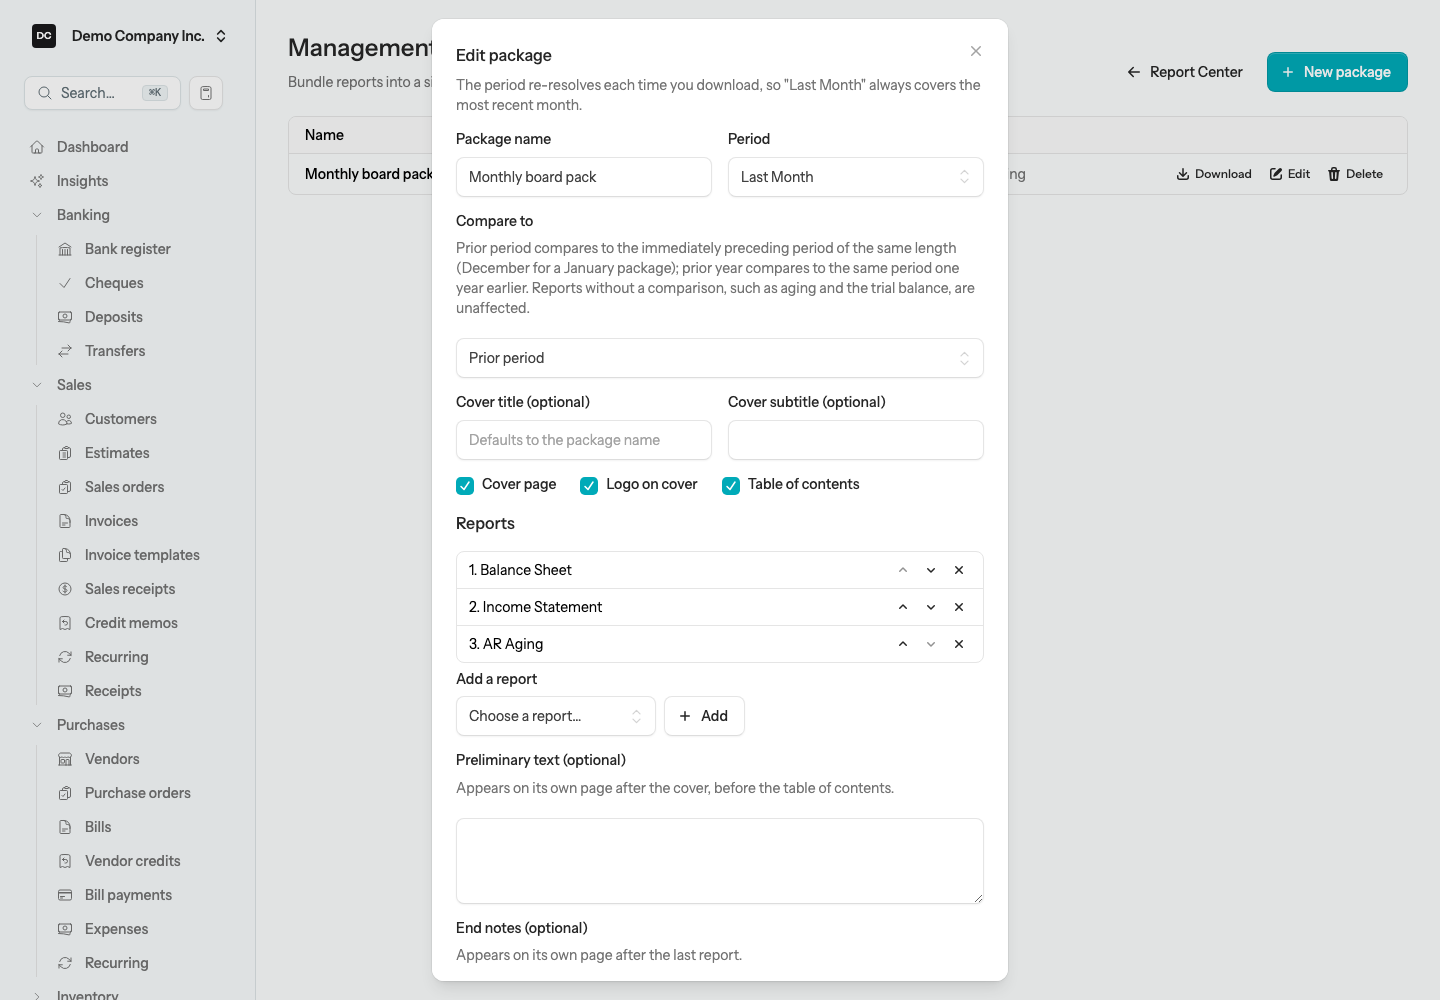
Management Reports bundles several statements into one polished PDF — a cover page, a table of contents, and each report you choose — ready to hand to an owner, a board, or a lender. You build a package once and download it again every month: the period re-resolves each time, so a “Last Month” package always covers the most recent month. Find it under Company & Financial → Management Reports.
To build a report package:
- Open Management Reports and select New package. Give it a Package name and choose a Period — a completed month, quarter, or fiscal year, or the current one to date. Balance-style reports (balance sheet, aging, trial balance) are as at the period end, or as of today for a to-date period.
- Optionally set Compare to → Prior period or Prior year to add a comparison column to every report in the package that supports one; aging and the trial balance are unaffected.
- Optionally type a Cover title and Cover subtitle, and tick or untick Cover page, Logo on cover, and Table of contents.
- Under Reports, pick from Add a report and select Add for each report you want — up to 20. Use the arrows to reorder them and the × to remove one. Preliminary text goes on its own page after the cover; End notes on a page after the last report.
- Select Save package. On the package list, select Download to generate the PDF, Edit to change it, or Delete to remove it.
Transactions
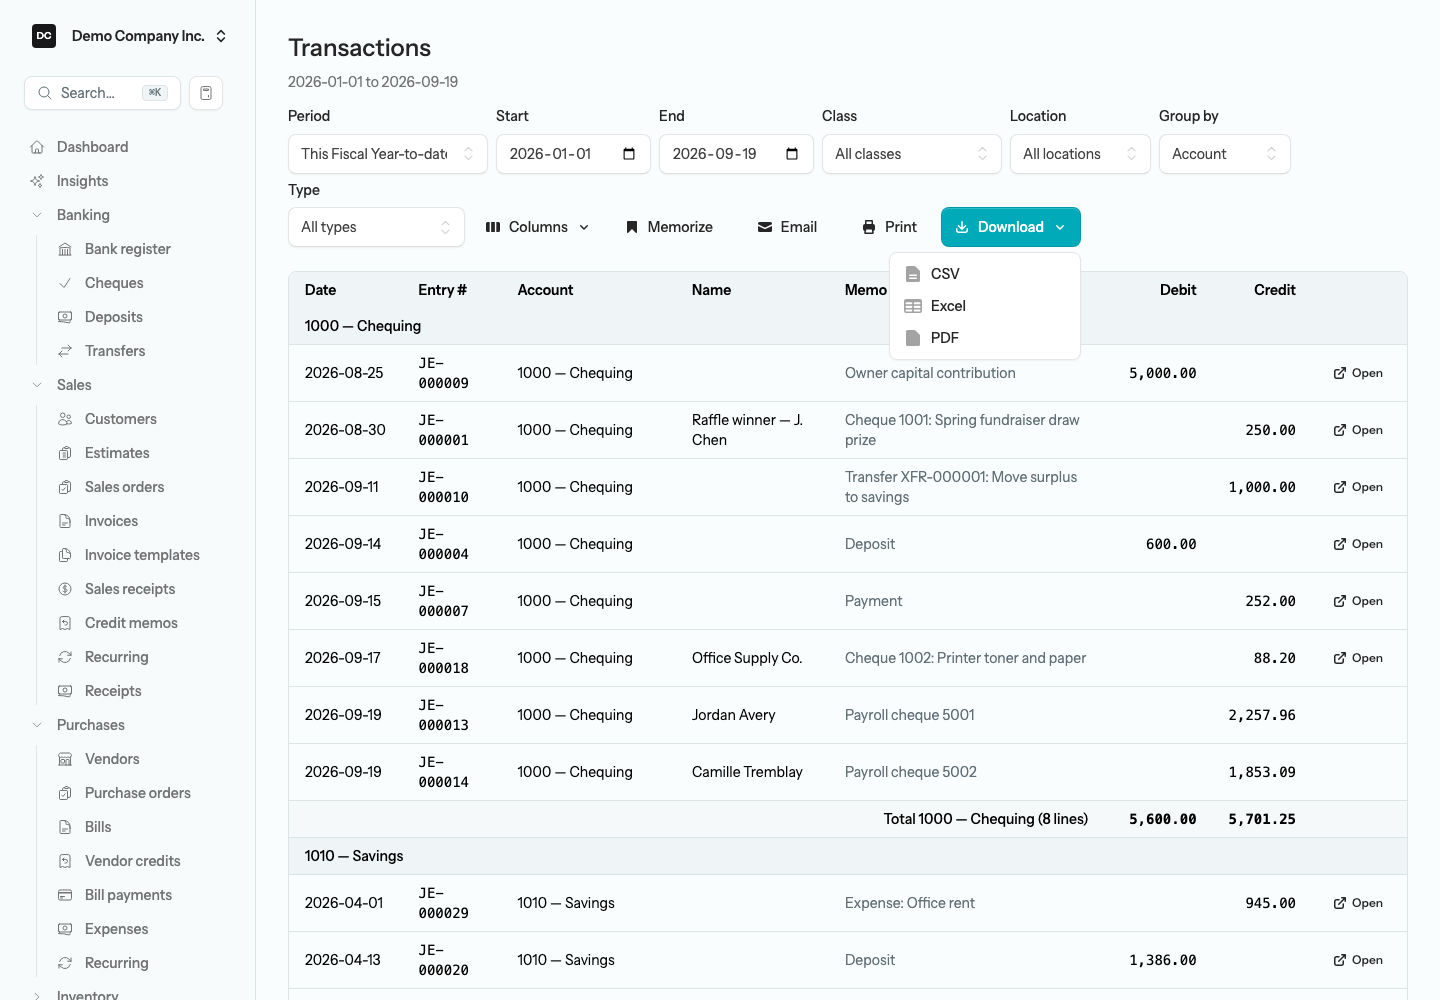
The Transactions report lists posted journal-entry lines across any combination of accounts, contacts, classes, locations, or funds for a date range. It is the workhorse behind the drill-through links on the statements — when you select an account on the Balance Sheet, Income Statement, or Cash Flow Statement, this is the report that opens, pre-filtered to that account and period. It has no card on the Reports hub; you reach it through those links, or through a customer or vendor name on Sales by Customer or Purchases by Vendor, and you can memorize it like any other report. Three controls shape the list: Group by (None, Account, Name, Month, or Source type) adds a subtotal per group; Type narrows it to one kind of source document — Journal entry, Invoice, Bill, Cheque, and so on; and Columns shows or hides Entry #, Name, and Memo. Each row has an Open button to jump to the transaction that posted it.
Transactions exports to CSV, Excel, and PDF from the Download dropdown. Rows are streamed straight from the filtered query, so a multi-year export against every account will not run out of memory. Use CSV for the smallest file to open in a spreadsheet, Excel for a formatted workbook with column types preserved, and PDF when the report is being filed with an accountant or attached to an email.
Receivables and payables
These reports tell you who owes you and who you owe, and how overdue each balance is. They live in the Customers & Receivables and Vendors & Payables groups.
AR Aging and AP Aging
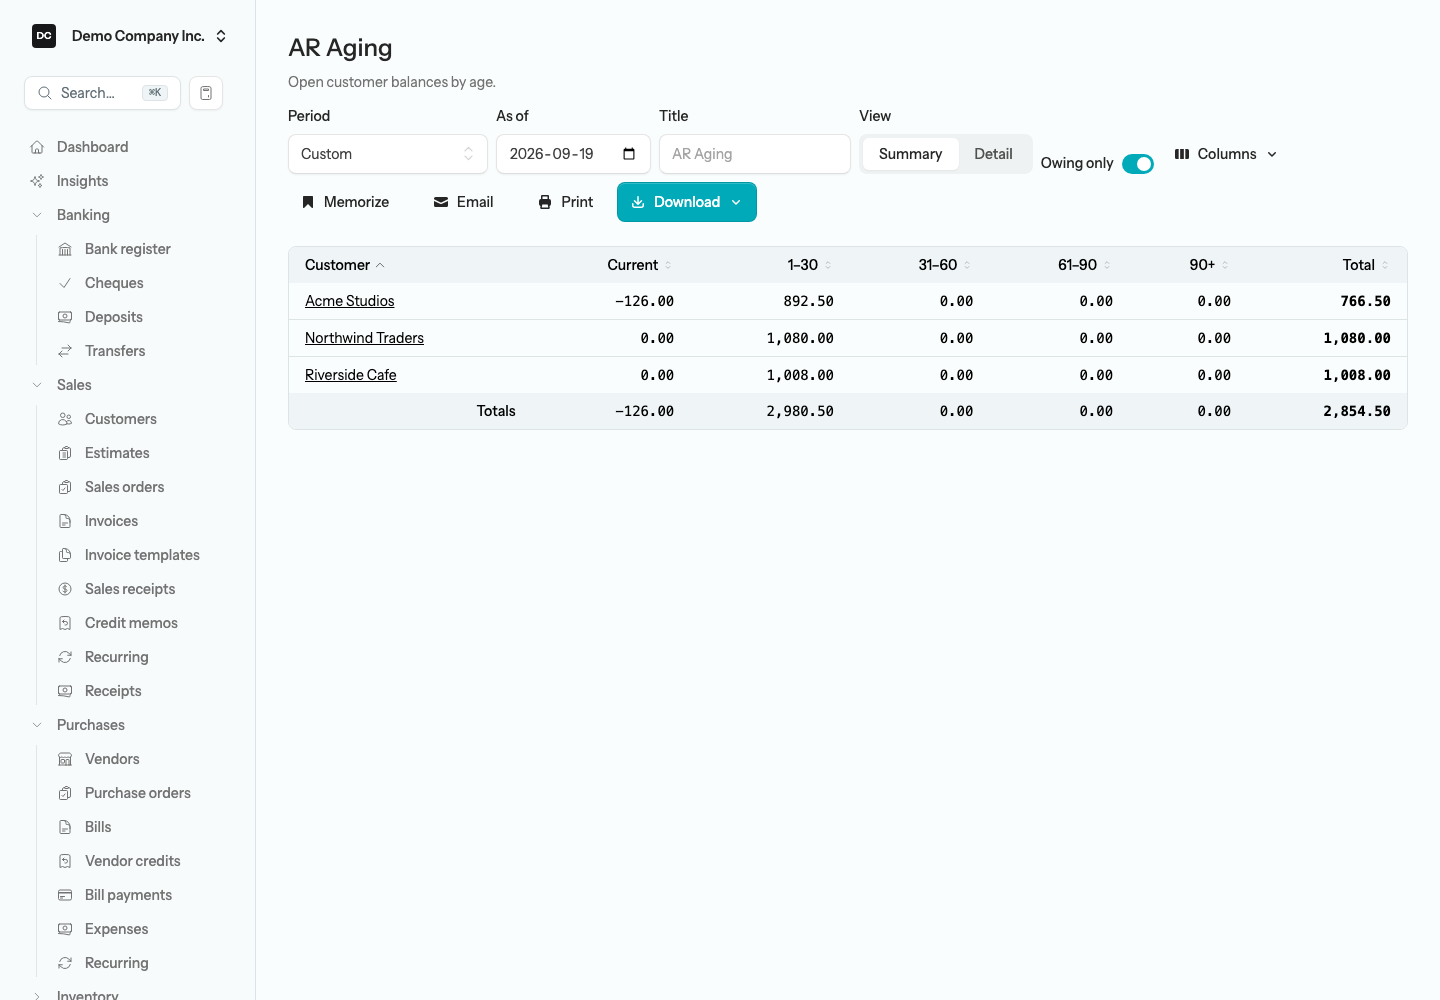
Open customer (AR) and vendor (AP) balances bucketed by how overdue they are — Current, 1–30, 31–60, 61–90, and 90+. Use AR Aging to chase receivables and AP Aging to plan upcoming payments. Set an As of date and sort by any column. Contacts with a zero balance are always left out. Owing only is on by default and also hides contacts with a credit balance — a customer whose unapplied payments or credits are more than they owe, or a vendor whose credits are more than your open bills — so only the balances actually owed remain. Switch it off to include those credit balances; the grand total then ties to the Accounts Receivable or Accounts Payable balance on the Balance Sheet. The View toggle switches between Summary — one row per customer or vendor, with a Columns picker — and Detail, which re-titles the report AR Aging Detail or AP Aging Detail and lists every open invoice or bill individually inside its bucket, each linked to the document. Each customer or vendor name is a link to their full statement, and both views export to Excel or PDF.
Open Invoices
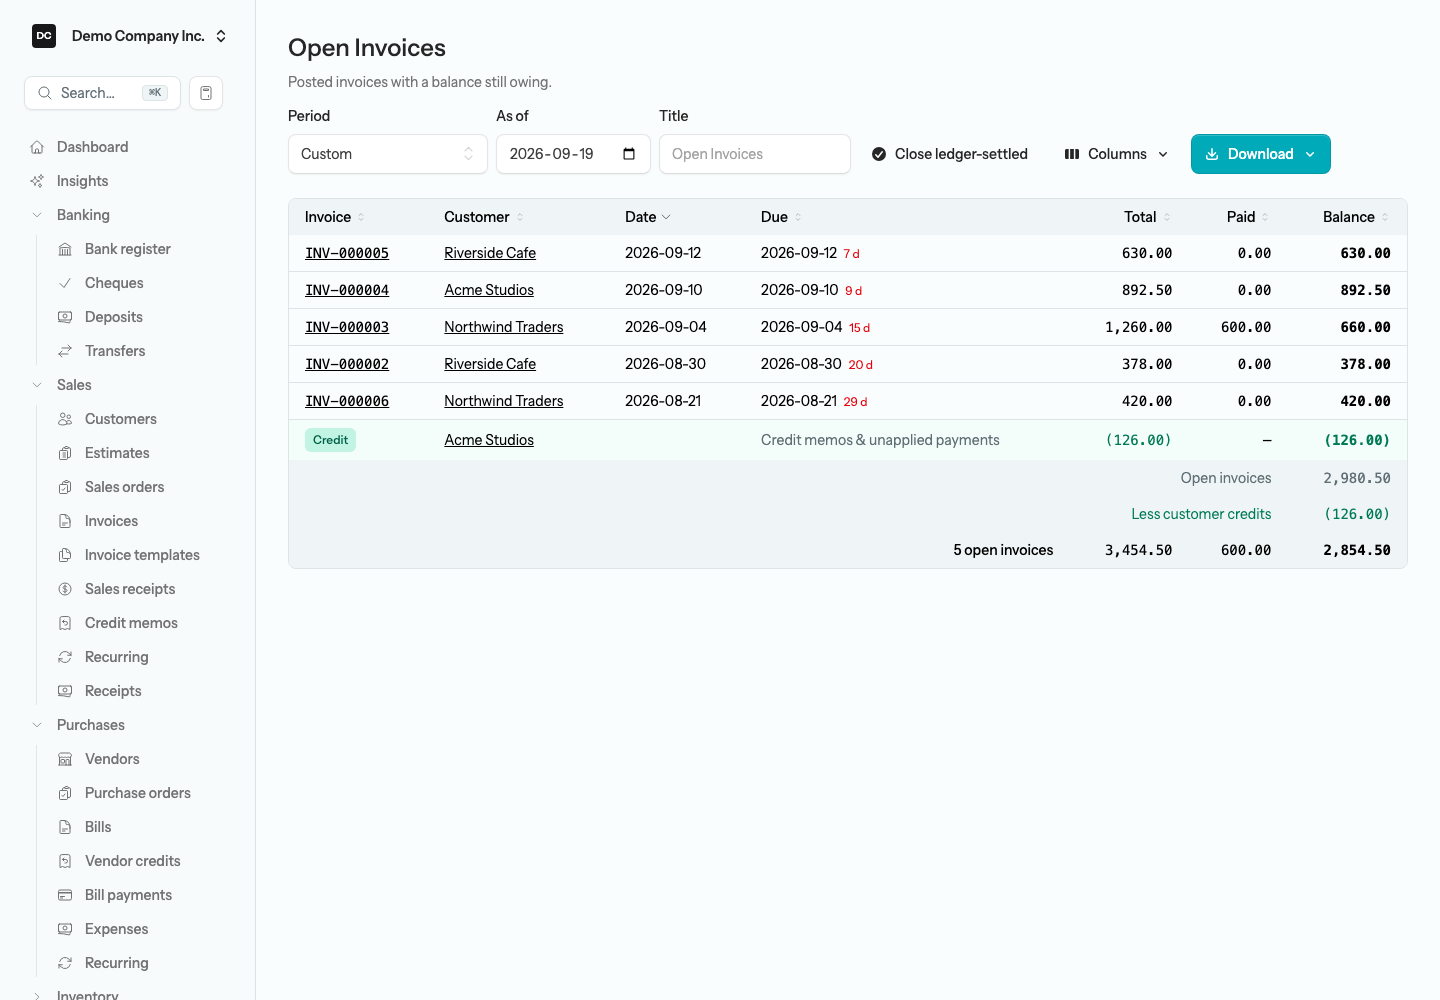
A flat list of every unpaid customer invoice as of a chosen date, with its document and due dates, days overdue, total, amount paid, and balance owing — the detail behind AR Aging without the buckets. Open it from Reports → Customers & Receivables → Open Invoices, or from the Accounts Receivable card on the dashboard, which links straight here. Sort the list any way you like and export to Excel or PDF.
Open Bills
The vendor-side mirror of Open Invoices: every unpaid vendor bill as of a chosen date, with document and due dates, days overdue, total, amount paid, and balance owing. Sort any way you like and export to Excel or PDF. Both Open Invoices and Open Bills include a Close ledger-settled action for the case where a balance was already cleared by a manual journal entry rather than a normal receipt or payment. It marks those documents settled to match the ledger, without posting anything new, so the open list stops showing balances the GL no longer carries.
Vendor Activity
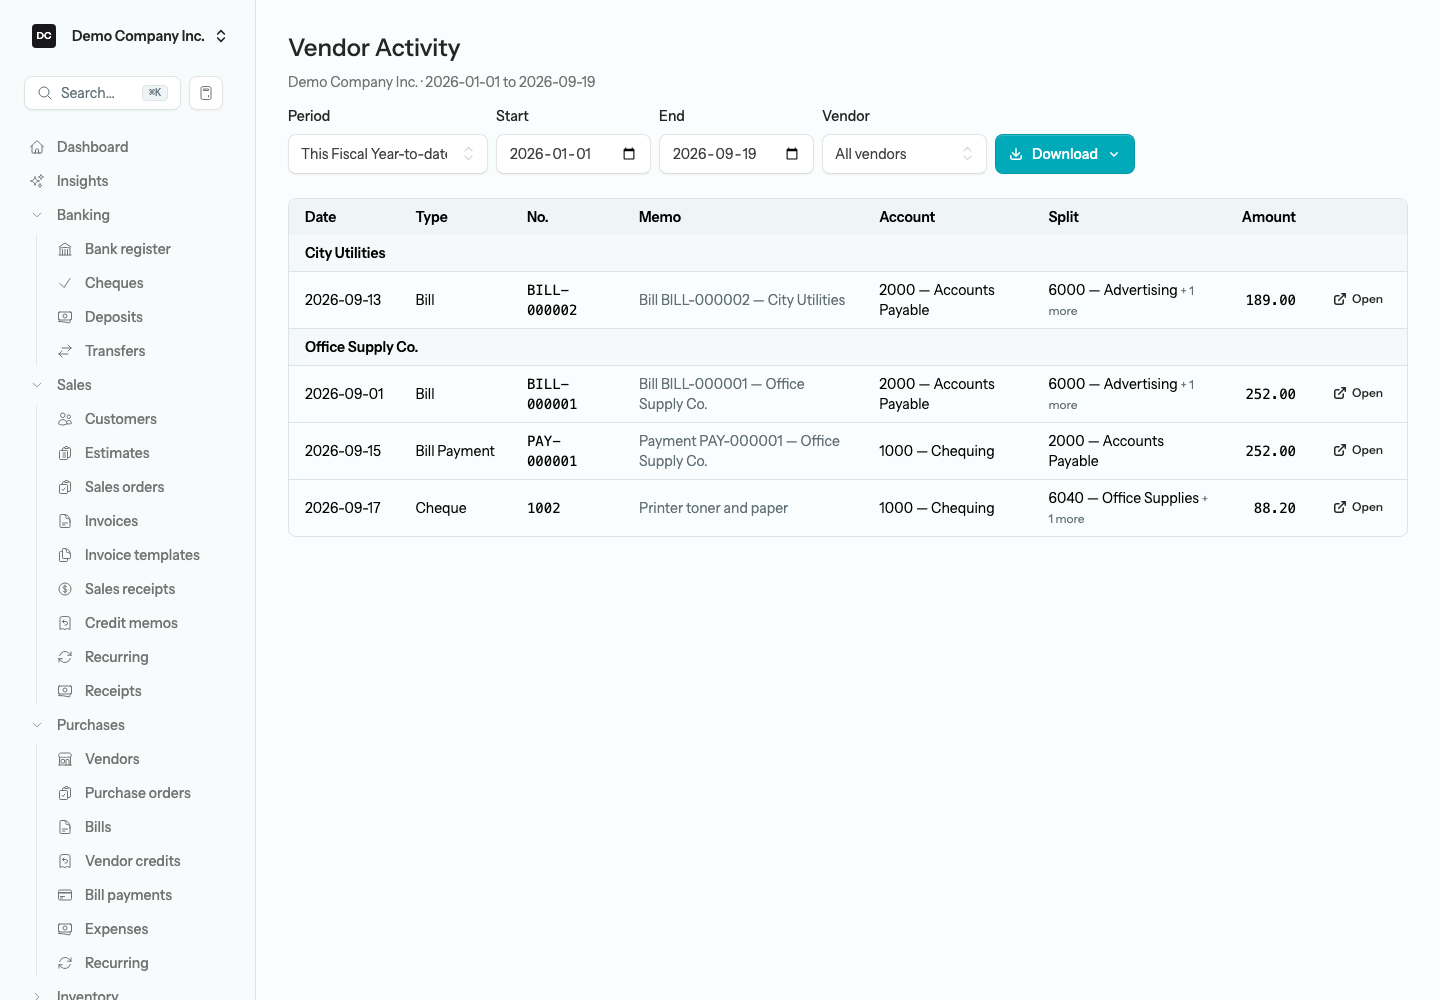
Every posted transaction with a vendor over a period — bills, bill payments, vendor credits, cheques, expenses, and journal entries — one row per document. This is the report to open when a vendor’s AP statement looks empty: the statement reads only the Accounts Payable account, so a vendor you pay by cheque or expense coded straight to an expense account never appears there. Vendor Activity reads the whole ledger, so those payments show up too. Open it from Reports → Vendors & Payables → Vendor Activity, or by selecting a vendor’s name on the Vendors list (the vendor’s Open balance opens the AP statement instead).
It opens at the fiscal year to date with every vendor grouped by name; pick one in the Vendor box to narrow it, and an AP statement button appears for that vendor. Each row shows the Date, Type, No., and Memo from the source document, the Account (the entry’s main account — the bank on a cheque, Accounts Payable on a bill), the Split (the accounts on the other side, largest first), and the Amount, with an Open button to jump to the document. A voided document is listed once, badged Void and struck through, and the reversal its void posted is left out so the pair does not read as two payments. The list shows 50 rows per page; CSV, Excel, and PDF export the full range.
Contact statement
Every transaction with a single customer (AR Statement) or vendor (AP Statement) over a date range, with an opening balance, the lined transactions, and a running balance to close. Open it from the AR/AP Aging links or from a contact record. Each Doc # is a link to the document, and Edit customer or Edit vendor opens the contact’s record for editing. On an AR statement a Statement… button opens the customer-facing statement page, listing every open invoice — preview it, choose its columns, then download or email the PDF — and a Rep column shows the sales rep on each invoice — on screen and in the CSV, Excel, and PDF you download, but never on the copy the customer receives. Download it as CSV for spreadsheets, Excel for a formatted workbook, or PDF to file.
Unattributed AR
Posted Accounts Receivable lines that are not tied to a customer — usually the residue of an import or a manual journal entry. The report lets you select those lines and assign them to a customer in bulk, so receivables that were sitting against the control account without a name get attributed correctly and show up on the right statement.
Tax
Sales Tax
Per-agency tax collected on your sales versus the input tax credits you claimed on purchases, for a chosen period. Each row shows the agency, its payable account, tax collected on sales, tax paid (ITC), and the net owing — what you remit to the agency. A negative net owing means the agency owes you a refund. Select a Collected on sales or Paid (ITC) figure to open the line-by-line breakdown behind it. This report is the source of truth when filing a sales-tax return.
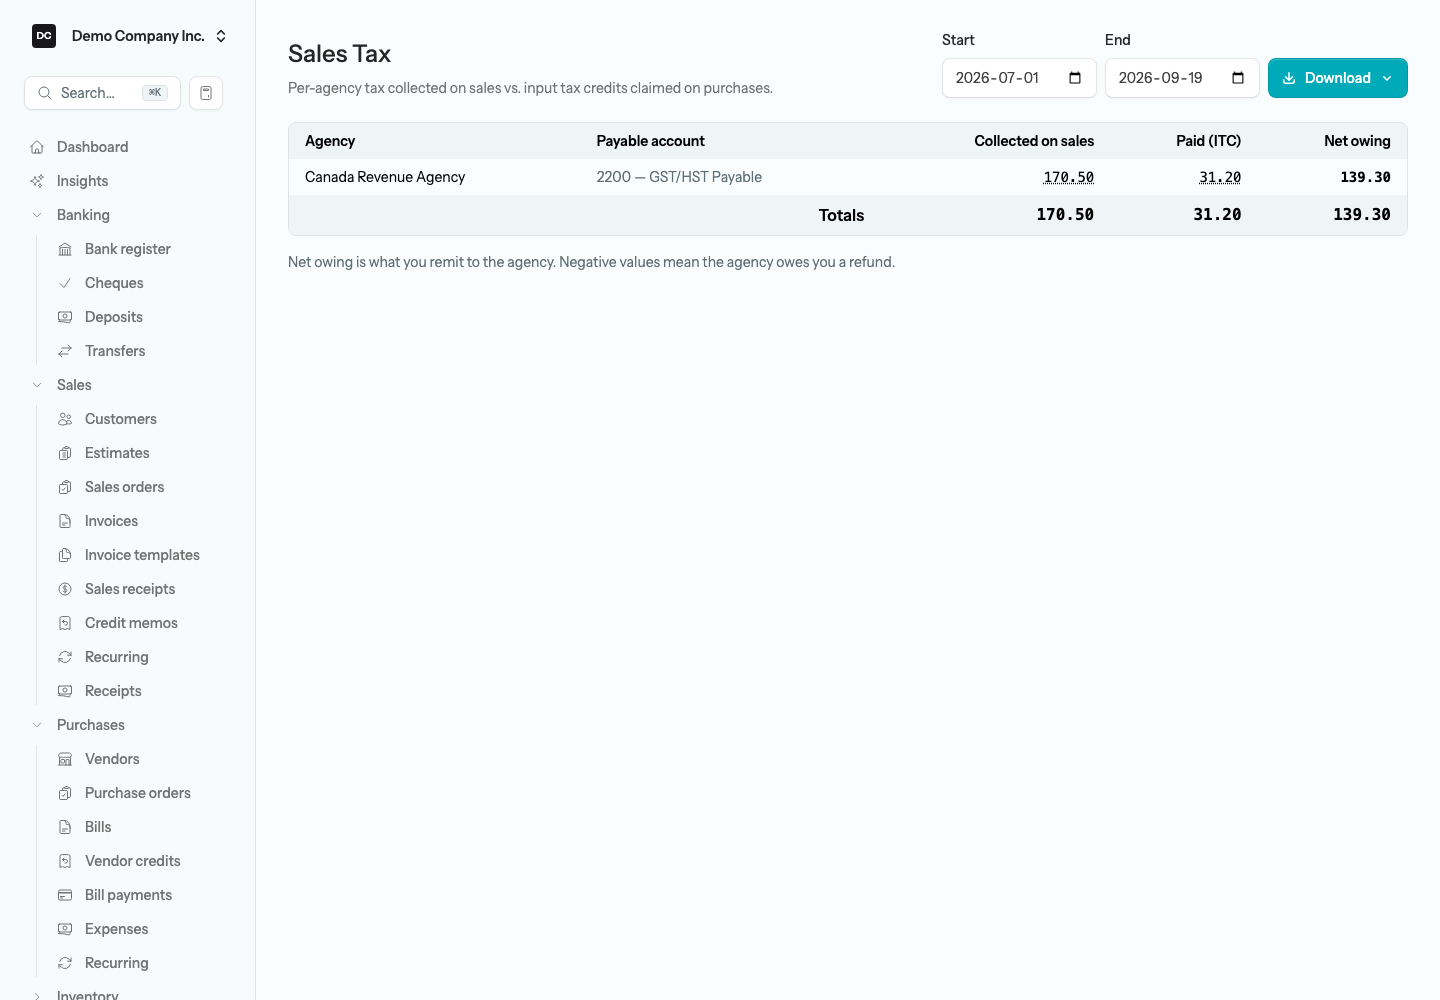
Note. The Sales Tax report feeds the Tax returns workflow — its collected, paid, and net-owing figures are exactly the numbers you file. When you file a period, a tax return captures it as a permanent record, and the lines and dates of bills and invoices touching that period become read-only to protect the filed numbers. See Tax returns for how to file a period, record remittances, and reopen a filing.
VAT Return (UK only)
For UK organizations, the VAT Return report works out the nine boxes of your HMRC VAT return for a quarter — VAT due on sales (Box 1), VAT reclaimed on purchases (Box 4), the net to pay or reclaim (Box 5), and the ex-VAT value of your sales and purchases (Boxes 6 and 7, in whole pounds). Boxes 6 and 7 count every line coded to a VAT rate, including zero-rated and exempt ones; lines with no tax code are treated as outside the scope of VAT. Boxes 2, 8 and 9 only apply to Northern Ireland trade in goods with the EU and show as zero. It opens on your last complete quarter and exports to CSV. A UK tax return shows the same nine boxes and freezes them when you file. The report does not appear for Canadian or US organizations.
How each box is worked out is set out on United Kingdom & VAT.
1099 Summary (US only)
For US organizations, the 1099 Summary totals what you paid each vendor you flagged for 1099 tracking over a calendar year — counting posted bill payments, cheques, and pay-now expenses, but not refunds. Vendors under the $600 reporting threshold are hidden by default, with a toggle to show everyone. Amounts report as nonemployee compensation (1099-NEC Box 1). Export to CSV, Excel, or PDF. To use it, flag the vendor and record their Tax ID on the vendor record. The report does not appear for Canadian organizations.
Sales and purchases analysis
These reports slice your activity by who, what, and which seller, so you can spot your best customers, your top-selling items, and where the money goes. They live in the Sales, Purchases, and Inventory groups.
- Sales by Customer — revenue per customer over a period, net of credit memos, so you can see where your income concentrates.
- Sales by Customer (Detail) — every sales document per customer over a period — invoices and sales receipts, net of credit memos.
- Sales by Item — revenue and quantity sold per item or service over a period.
- Sales by Rep — revenue per sales rep over a period, with a Compare control and a drill-down per rep (below).
- Purchases by Vendor — total spend per vendor over a period, net of vendor credits.
- Purchases by Item — spend and quantity purchased per item over a period.
- Open Purchase Orders — purchase orders not yet fully received (shown when purchase orders are turned on).
- Inventory Valuation — the current carrying value of every inventory item still on hand.
- Stock Status — on-hand quantities and reorder points so you know what to restock.
Sales by Rep drill-down
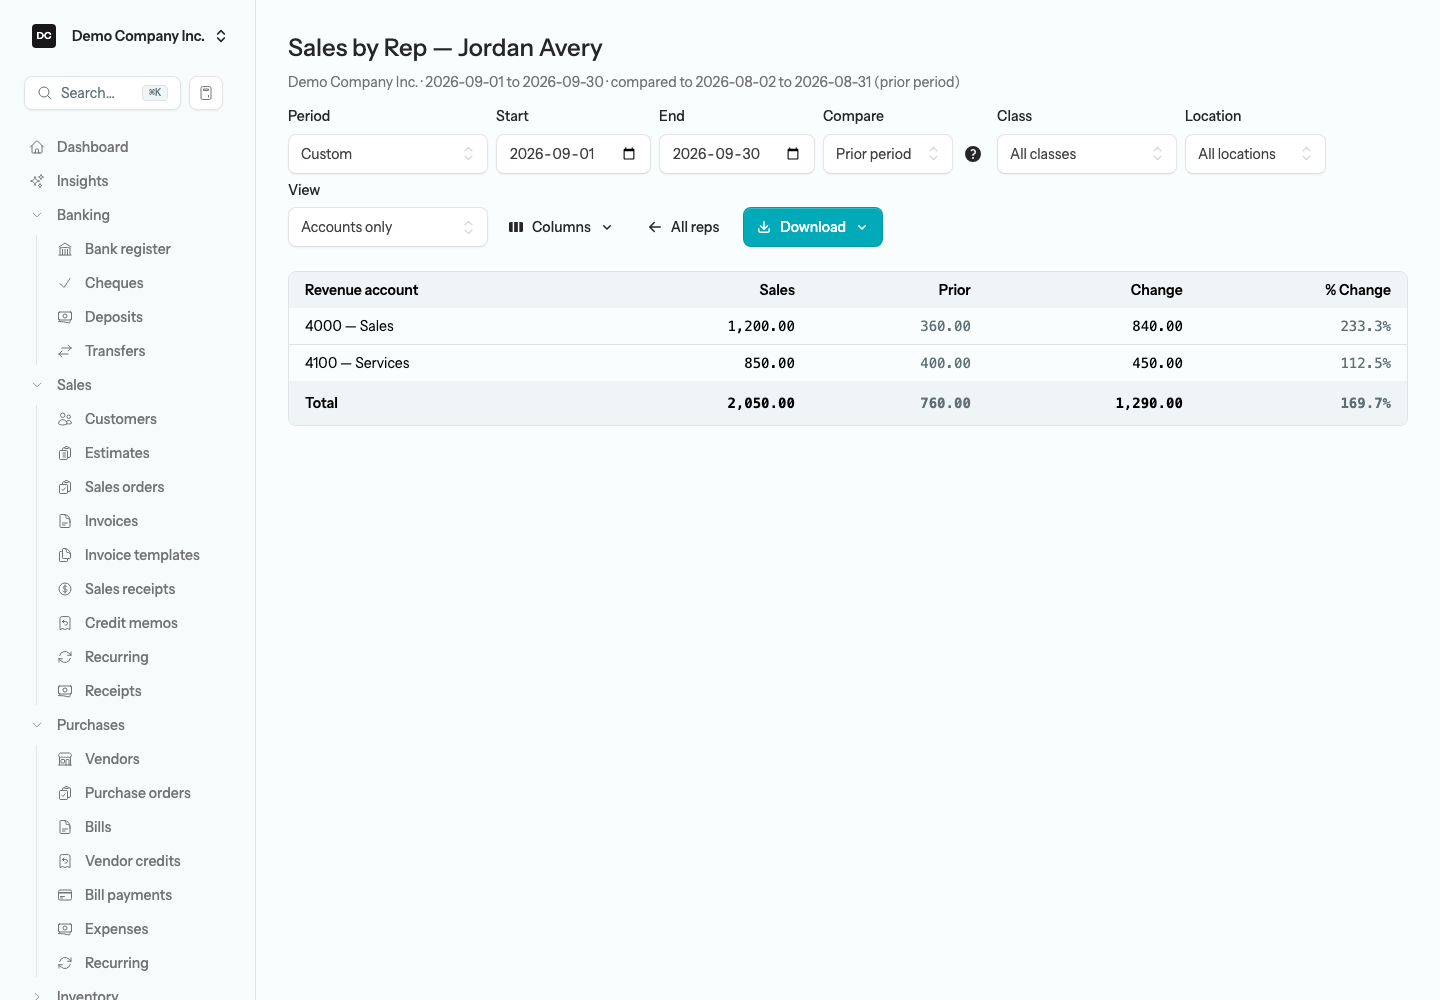
On Sales by Rep, each rep’s name is a link. Select it to open that rep’s own report for the same period. The View control offers two layouts: Accounts & documents (the default) groups the rep’s invoices and credit memos under each revenue account with a subtotal per account and a link on every Doc #; Accounts only collapses that to one row per revenue account, ordered by account code so it reads like a mini Income Statement. The Accounts only view also accepts the Compare control, adding Prior, Change, and % Change columns you can show or hide with Columns. Only invoices and credit memos carry a rep, so sales receipts are not included, and the drill-down’s total always ties back to the rep’s row on the summary. Select All reps to return.
Reports for non-profits and charities
When your organization is set up as a non-profit, a Non-profit group appears with statements that follow the accounting standards for not-for-profit organizations (ASNPO) — presenting net assets by class rather than owner’s equity:
- Statement of Financial Position — the non-profit balance sheet: assets, liabilities, and net assets by class.
- Statement of Operations — revenue and expenses with the excess (or deficiency) of revenue over expenses for the period.
- Statement of Changes in Net Assets — opening to closing net assets by class, with the period’s surplus and any transfers between funds.
Turn on membership or fundraising and matching groups appear too. Membership adds a Membership Roster of every member with their level and term, plus Dues Revenue by Level. Fundraising adds Donations by Donor, Donations by Fund (once you track funds), and a Grants Summary. Demo Community Society shows both. See Members and Fundraising for the workflows that feed these reports.
Accountant and tax filings
The Accountant & Taxes group gathers the reports your accountant reaches for at year-end. The Trial Balance and General Ledger covered above live here too, alongside the CRA-format schedules. Which of these you see depends on how the organization is set up, so the schedule that matches your filing is the one that appears:
- GIFI Statement (corporations) — your balance sheet (S100) and income statement (S125) mapped to the CRA’s General Index of Financial Information codes for the T2 corporate return.
- T5013 Partnership — the partnership GIFI schedules plus the income allocation across partners.
- T2125 Business Activities (sole proprietors) — the statement of business or professional activities, including the capital cost allowance (CCA) schedule.
- T3010 Summary (registered charities) — the receipted donations, revenue, expenditures, and balance-sheet totals you need for the annual charity information return.
Payroll has its own set of reports — the payroll register, PD7A and Revenu Québec remittances, T4, T4A and RL-1 slips, the Record of Employment, and more — under the Employees & Payroll group when payroll is turned on. See the Payroll guide for those.
Audit Logs
A timeline of every change made inside the organization — who did what, when, and what changed. Only owners see it. The Accounting tab records every posting action (invoices, bills, credit memos, receipts, payments, cheques, deposits, journal entries, and tax returns: created, posted, reposted, or voided) with the actor, IP, and a snapshot of what changed. The Security tab records sign-ins, password and two-factor changes, team-membership changes, and API-key lifecycle events (created, rotated, revoked). Actions taken through the API are attributed to the API key rather than a person, so you can tell automated activity from manual work. The accounting log is append-only and cryptographically chained — each entry is hashed together with the one before it — so tampering is detectable. Use the Verify chain action to confirm the log has not been altered.
List reports
The Lists group holds plain reference exports rather than financial statements: an Account List (every account with its type, currency, and balance), a Customer Contact List, and a Vendor Contact List (names, contact details, terms, and open balances). All three hide inactive records until you switch on Include inactive, and the two contact lists have a Search box that matches name, company, or email. They are handy for a quick directory or a spreadsheet hand-off, and can be memorized, emailed, and printed like any other report.
Combined reports across organizations
If you keep the books for more than one organization, combined report groups let you consolidate their financial statements into a single view. A group combines two to ten organizations that share the same currency: you create the group, add the members, and the app maps their accounts onto shared combined lines by account code — accounts that share a code go onto one line, and an account whose code no other member uses gets a line of its own. From a group you can then view a combined Income Statement, Balance Sheet, Cash Flow Statement, and Trial Balance — each reading live from the posted books of every member. The Report Groups card in the hub’s Combined / Multi-company group takes you to the same place.
To create a combined report group:
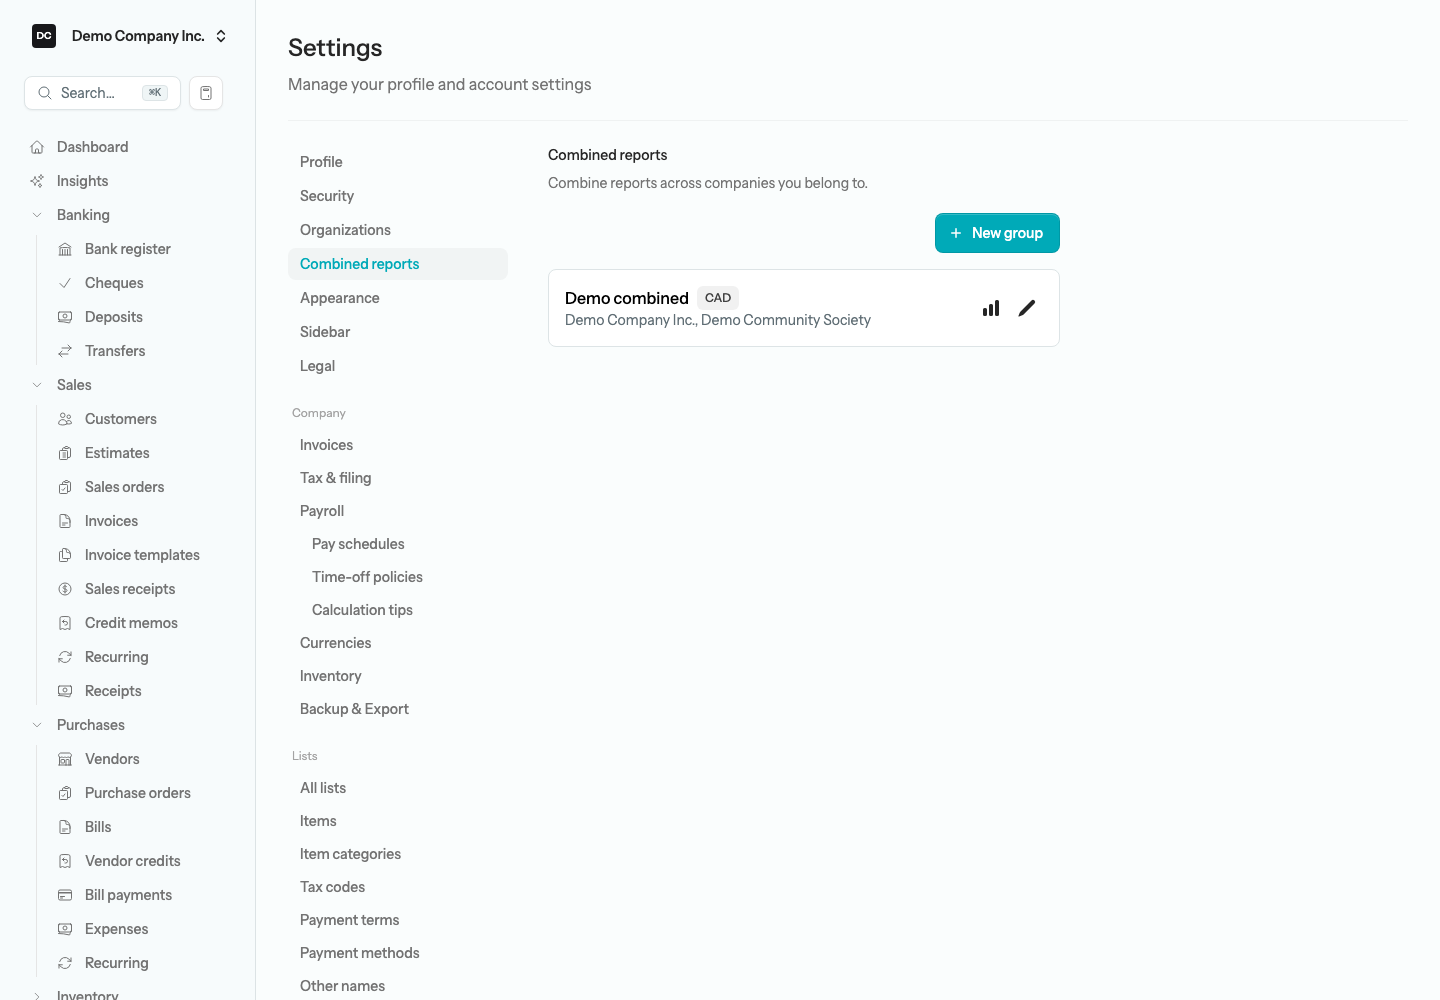
- Go to Settings → Combined reports and select New group.
- Give the group a name and tick the two to ten organizations you want to combine. Each one shows its currency beside its name.
- Select Create. The app auto-maps the members’ accounts by account code: accounts that share a code go onto one combined line, and an account whose code no other member uses gets its own line.
- On the group’s edit page (the pencil on its row), rename or retype the combined lines and move accounts between lines. An organization you add with Add company is mapped straight away. Auto-map new accounts picks up only accounts that are still unmapped — such as ones created since — and keeps your existing lines.
- Select View reports to open the combined Balance Sheet, then switch between the combined Income Statement, Cash Flow Statement, and Trial Balance from there. The chart icon on the group’s row in the list opens the same reports.
Inside a group you can rename or retype the combined lines and organize them into custom sections, and switch on By company to see each member’s figures beside the combined total — on the Cash Flow Statement that includes each member’s net cash per activity and its beginning and ending cash. Combined statements export to CSV, Excel, and PDF. A group is a straight roll-up, not a full consolidation — there are no intercompany eliminations, so balances owed between member organizations are not removed. Every organization in a group must use the same currency. A group is visible to anyone who belongs to all of its members, so a colleague on every member organization sees the combined reports too (badged Shared); only the person who created it can edit it.
Saving, emailing, and scheduling reports
Memorized reports and groups
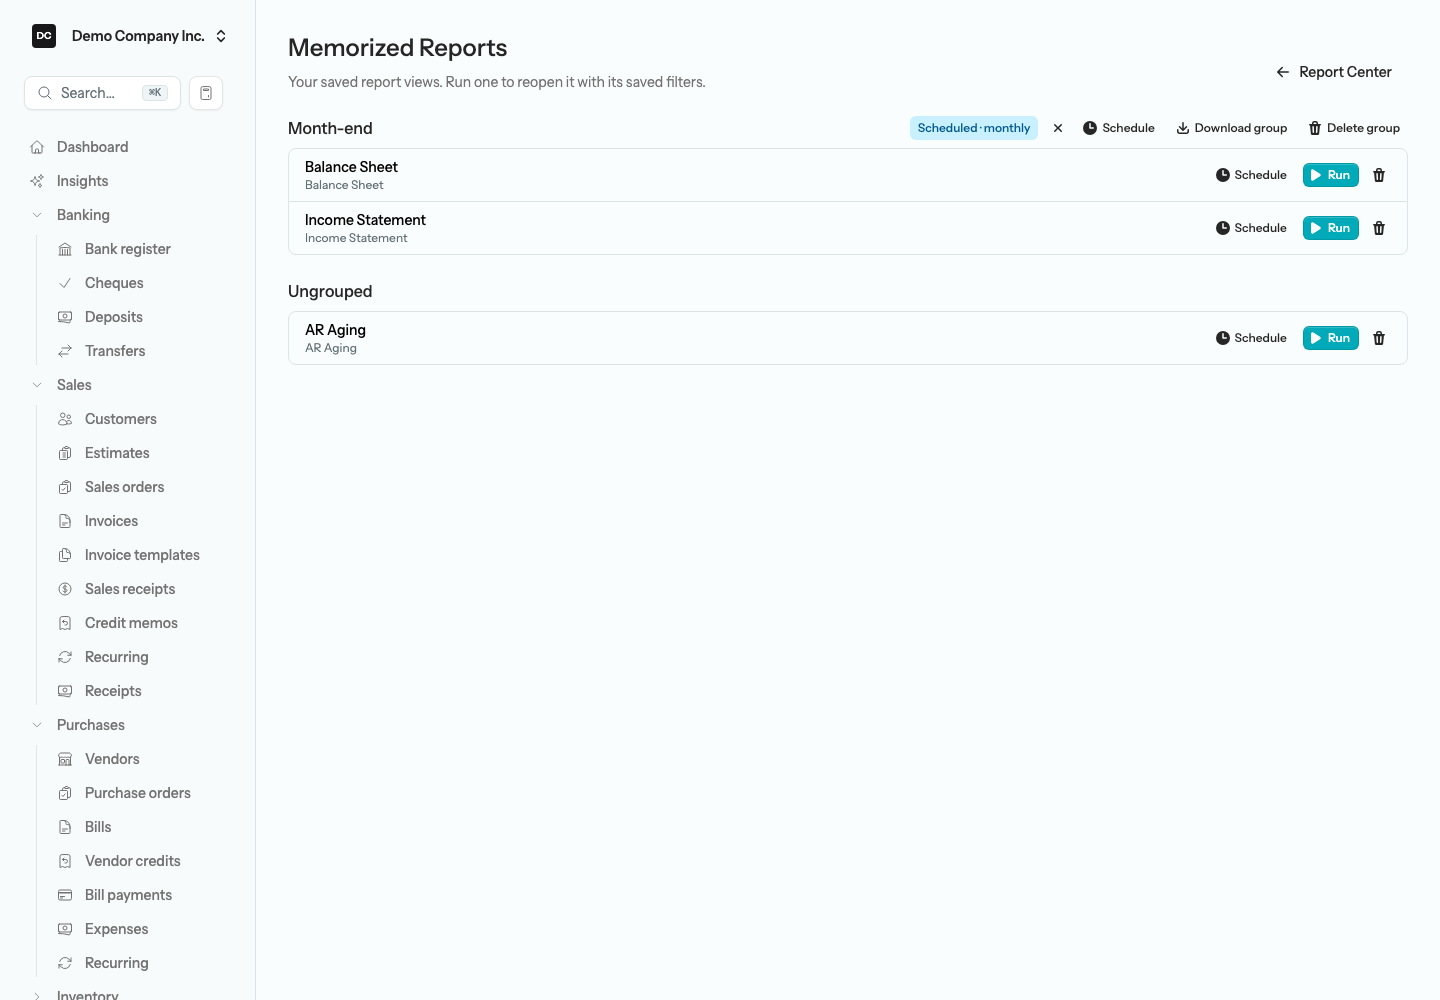
When you have a report set up just the way you like it, select Memorize to save it with its current period, filters, columns, and title. Memorized reports live on the Memorized Reports page — the Memorized button at the top of the Reports hub — so a report you run every month is one click away with the same settings. You can file memorized reports into groups such as “Month-end” or “Board pack”; a group is also what you point an email schedule at, and Download group hands you every report in it as a single ZIP of PDFs. Memorized reports and groups are yours alone — a colleague builds their own.
To memorize a report:
- Open the report and set the period, filters, columns, and title you want.
- Select Memorize in the control bar and give it a Name.
- Optionally pick an existing group under Group (optional), or type a name into Or new group (optional) to create one.
- Select Save. On the Memorized Reports page, select Run to reopen it, or the trash icon to delete it. Deleting a group moves its reports to Ungrouped. A report the organization can no longer run — say, a payroll report after payroll is turned off — is badged Unavailable.
Emailing a report
Any report that can render to PDF — the statements, Trial Balance, Transactions, aging, Cash on Hand, and the lists — has an Email button in its control bar. It sends the report as a PDF attachment exactly as currently filtered: enter up to ten addresses in To (separated by commas), a Subject, an optional Message, tick Also attach as Excel if you want the workbook too, and select Send. The email is queued and the PDF is rendered at delivery, so what the recipient opens matches what was on your screen.
Scheduled report emails
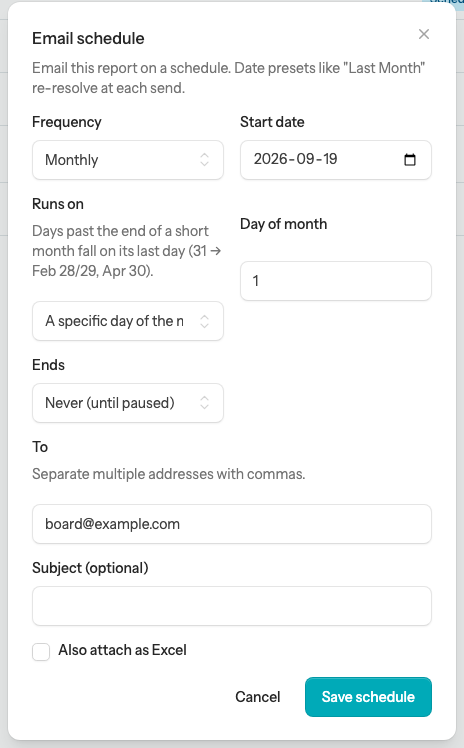
A memorized report — or a whole group — can be emailed automatically on a schedule, so the month-end pack reaches the board without anyone remembering to send it. Date presets such as Last Month re-resolve at each send, so the same schedule always covers the most recent period. Each report or group holds one schedule; saving a new one replaces it.
To schedule a report email:
- On the Memorized Reports page, select Schedule on the report row or beside the group heading.
- Choose a Frequency — Weekly, Monthly, Quarterly, Semi-annual, or Annual — and a Start date.
- For anything but Weekly, choose Runs on: A specific day of the month (then set the Day of month, 1–31 — days past the end of a short month fall on its last day), Last day of the month, or Last business day of the month (the last Monday–Friday; statutory holidays are not skipped). Quarterly and longer cadences use the last month of each period.
- Set Ends to Never (until paused), On date with an End date, or After number of occurrences with a Number of sends.
- Enter the recipients in To (up to ten, separated by commas), an optional Subject, and tick Also attach as Excel if you want the workbook alongside the PDF. Select Save schedule.
Note. A scheduled report or group shows a badge such as “Scheduled · monthly”; select the × beside it to remove the schedule. A schedule ends itself after its End date or Number of sends, and pauses — badged Schedule paused — if the report can no longer be emailed, for example because the feature it reports on was turned off. Sends go out with the daily scheduled tasks each morning, so on a self-hosted install the scheduler and queue worker must be running — see Self-hosting.