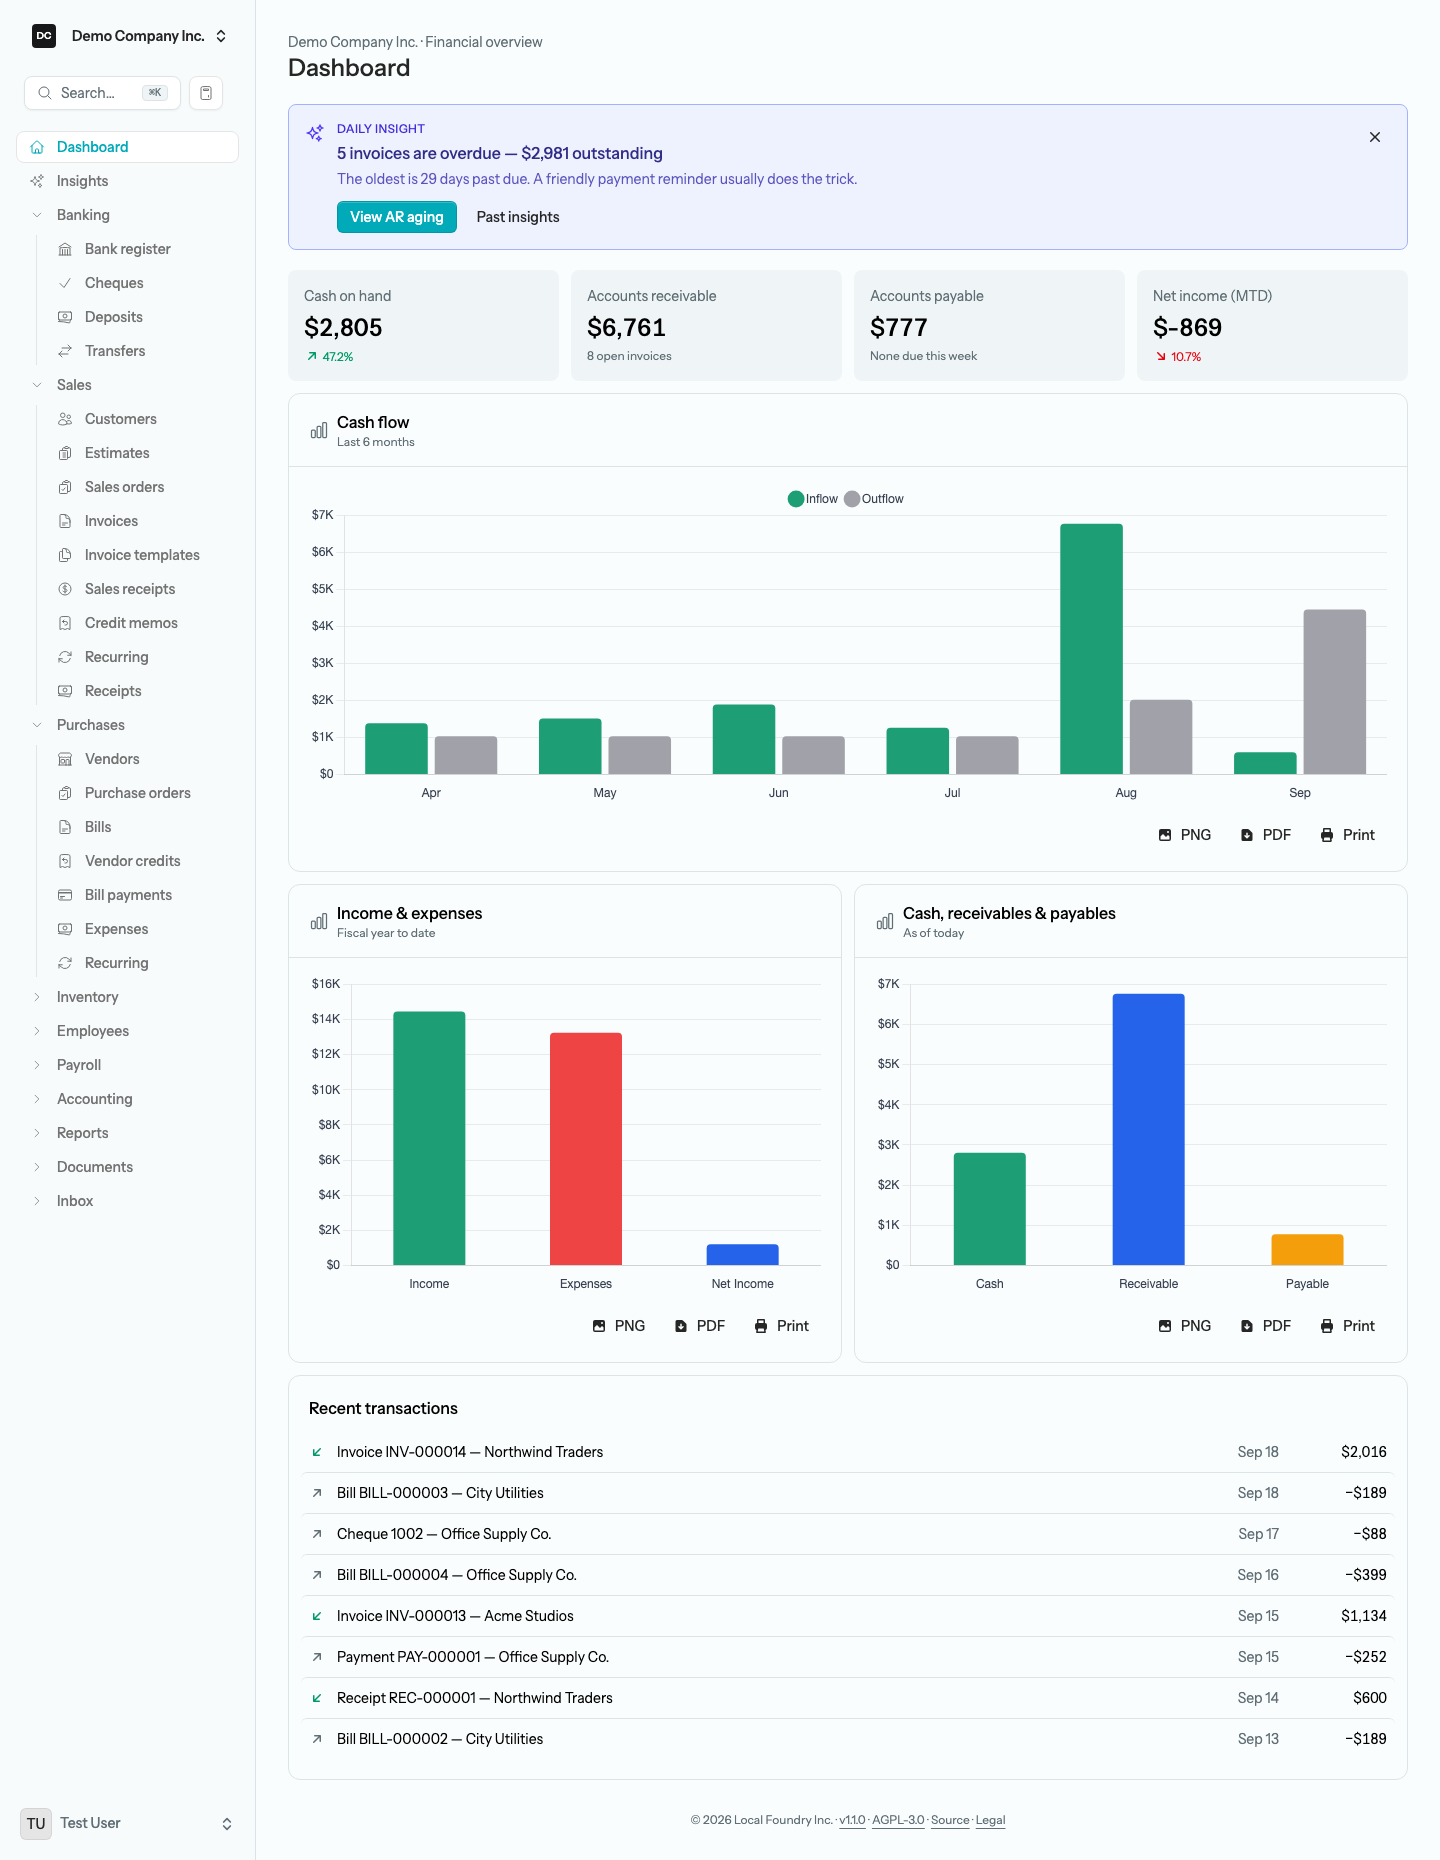
The Dashboard is the first page you land on after signing in to an organization. It is a live financial overview: four headline numbers across the top, today’s insight, a row of charts, and your most recent transactions — all read straight from the posted books, so what you see always agrees with your reports. The examples below use our sample business, Demo Company Inc.
The four summary cards
Each card shows one headline number in whole dollars and links into the report behind it, so the Dashboard doubles as a launchpad — select a card to jump straight to the detail.
- Cash on hand — every bank and undeposited-funds balance added up as of today, with the percent change versus 30 days ago (green with an up arrow when it grew, red with a down arrow when it shrank; “No prior data” until there is a balance to compare with). Select the card to open the Cash on Hand report, which lists each account behind the total.
- Accounts receivable — the balance of your Accounts Receivable account as of today, with a count of the open invoices behind it. It matches AR Aging and the general ledger to the cent — an invoice dated in the future is not receivable yet, so it is not counted. Select the card to open the Open Invoices report.
- Accounts payable — the balance of your Accounts Payable account as of today, with how many open bills fall due within the next seven days (“None due this week” otherwise). Select the card to open the AP Aging report.
- Net income (MTD) — income minus expenses so far this month, with the change versus the same number of days into last month. Select the card to open the Income Statement.
Tip — AR card → Open Invoices. Selecting the Accounts receivable card opens the Open Invoices report — a faster, current-balance view than AR Aging when you just need to see who still owes you. See the Reports page for the full set of receivable reports, including AR Aging when you do need it bucketed.
The daily insight
Above the cards, a “Daily insight” card surfaces one thing worth knowing about Demo Company Inc. today — an overdue receivable to chase, a bill due soon, sales tax to set aside, a record sales month, and so on. A scheduled job picks the most relevant insight each morning and stores it; the card shows today’s insight, or yesterday’s if this morning’s has not run yet for your time zone. Nothing is computed while the page loads, so on a quiet day with nothing to say the card simply does not appear.
Each insight has a headline, a one-line explanation, and a button that takes you to the matching page — “View forecast”, for example. Select “Past insights” — or Insights in the sidebar, just under Dashboard — to browse earlier days, or close the card with the × to hide that day’s insight on this browser only; your colleagues still see it, and the next new insight reappears on its own. When the wording was phrased by AI from your aggregate totals, a small AI badge appears — the numbers themselves always come from your posted ledger.
The Insights page is where the rest lives: a “Show daily insights on my dashboard” switch that hides the card altogether for you (and a button to bring today’s insight back if you closed it by mistake), the full history, and the Financial health panel of fiscal-year-to-date ratios. The Insights page of this manual walks through all of it, including every kind of insight the app can raise.
Note — Cash running low? Two of the daily insights watch your cash runway using the same engine as the Cash flow forecast, described next. If open invoices and bills are projected to push your committed cash balance below zero within the next 13 weeks, an urgent “Cash may run short around …” insight names the date. A softer “Cash is set to dip about …% this quarter” insight fires instead when the balance stays positive but is projected to drop by at least $1,000 and at least 40% of today’s cash. Both carry a View forecast button.
Cash flow forecast
The Cash flow forecast is the forward-looking companion to the Dashboard’s Cash on hand card. It projects where your cash is headed over the next 13 weeks or 6 months from four inputs already in your books — open invoices, open bills, post-dated entries, and your recent run-rate — and warns you before the balance would fall below a floor you choose. Open it from Reports → Company & Financial → Cash Flow Forecast, or from the View forecast button on a cash-runway insight. It is deterministic: the same books always produce the same forecast, and every figure can be traced to the documents behind it.
To run the forecast:
- Open Reports and select Cash Flow Forecast from the Company & Financial group.
- Choose Weekly for the next 13 weeks (each period a week starting today) or Monthly for the next 6 months (the rest of this month, then whole calendar months).
- Optionally type a figure into Low-cash alert at — the balance you never want to drop below. Leave it blank to be warned only when cash would go negative.
- Optionally change Ignore receivables overdue past — how many days overdue an invoice can be before the forecast stops counting on it. The default is 90 days.
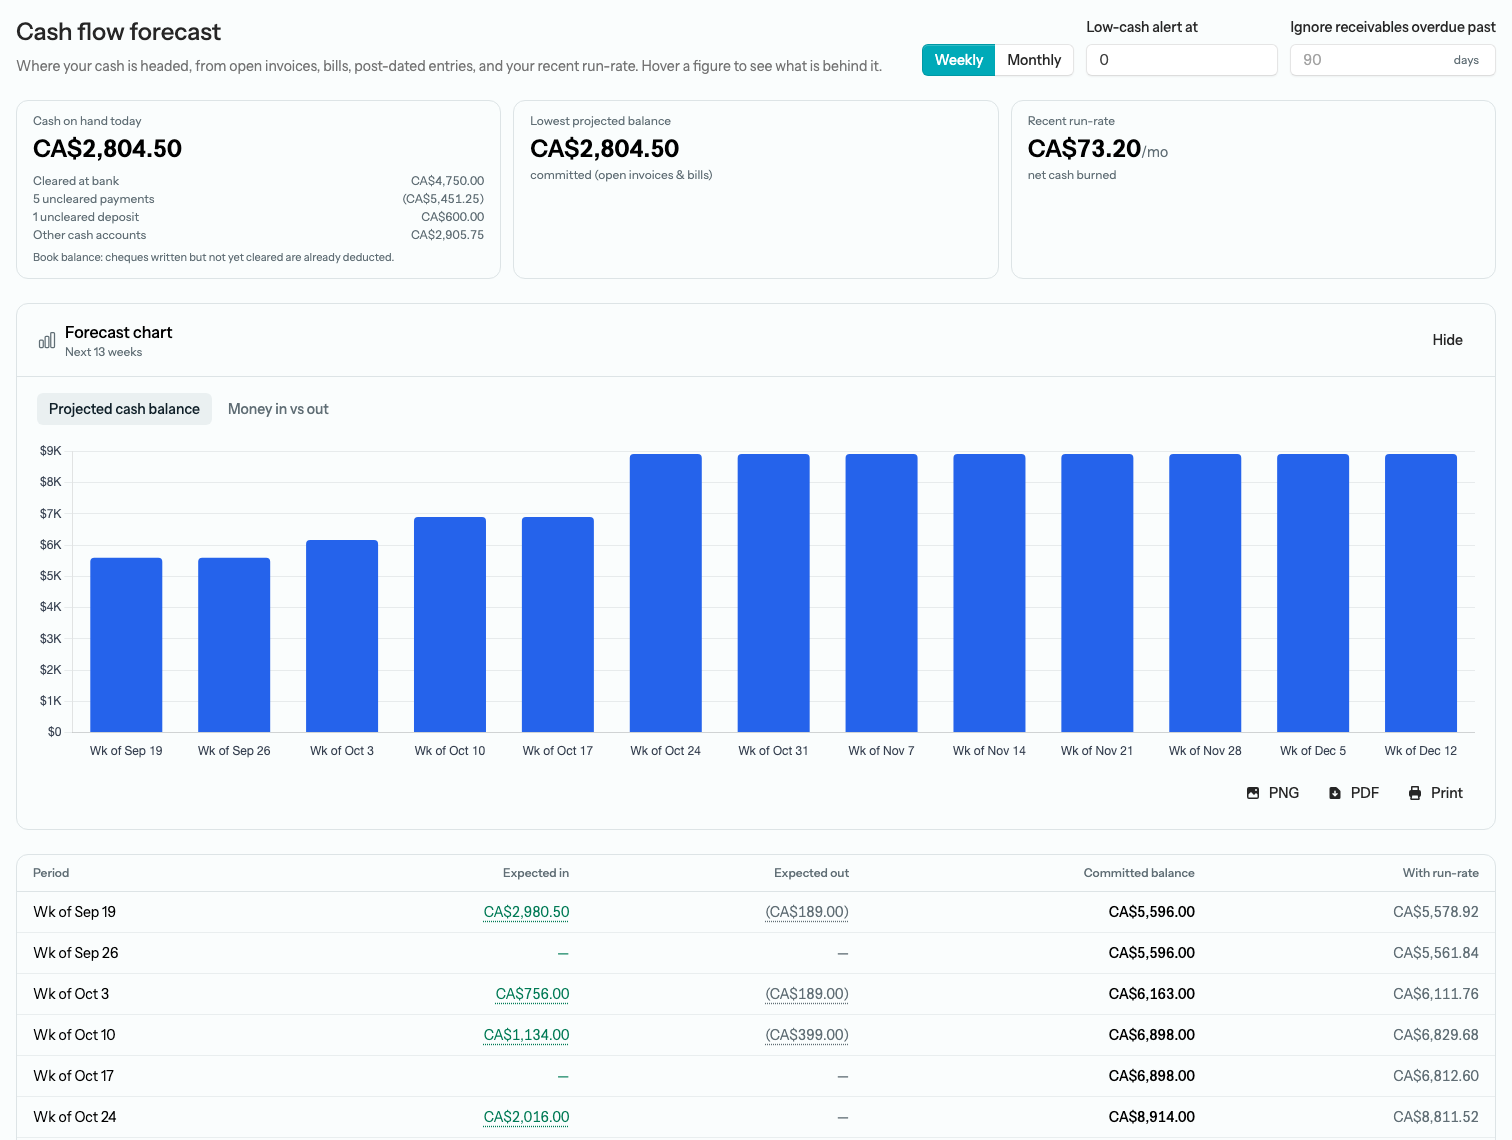
- Read the three summary tiles, then scan the chart and the period-by-period table. Hover any Expected in or Expected out figure to see exactly what is behind it.
All three settings are kept in the page address, so a bookmark or a shared link reopens the forecast the way you left it.
Two tracks: committed and with run-rate
Every period is projected twice, so you can tell a near-certainty from an estimate.
- Committed balance — the high-confidence track, built only from what is already on your books. It starts from today’s book cash (the same bank-plus-undeposited total as the Dashboard card, so cheques you have written but that have not cleared are already deducted). Each open invoice’s balance is added on the date it is realistically expected — its due date pushed out by how late your customers typically pay, learned from the invoices settled in the past year. That delay applies to overdue invoices too, so being overdue does not by itself put an invoice in the first period: it lands in whichever period its expected date falls in, and only one whose expected date has already passed is pulled forward into the first period. For example, if customers typically pay 12 days late, an invoice that is 5 days overdue is still expected 7 days from now, which is the second week on the Weekly view. Each open bill’s balance is deducted on its due date, overdue bills in the first period. Post-dated entries already posted to a cash account — a post-dated cheque, a future-dated bank charge — land on the date they are booked. Anything expected after the end of the horizon is left out. This is the track that drives the low-cash alert.
- With run-rate — the committed track plus an estimate of ordinary day-to-day operations: your net operating cash over the last 90 days, spread per day across each period. Because that run-rate already reflects the recurring bills and invoices you raise every month, recurring templates are deliberately not projected on top of it — that would count them twice.
The typical days-late figure is the median lag between due date and final receipt across invoices paid in the past year, capped at 90 days; the forecast needs at least three paid invoices before it will apply one, and the footnote under the table tells you what it learned — or “on time so far”. A receivable overdue by more than the cut-off is treated as doubtful: it is left out of the committed track and listed separately below the table.
Reading the page
- Cash on hand today — the forecast’s starting balance. Once you have reconciled a bank account, the tile also ties that book balance to the bank: the amount Cleared at bank, the uncleared payments (shown in parentheses), any uncleared deposits, and the balance sitting in Other cash accounts that are never reconciled, such as petty cash or Undeposited Funds. Until then it simply reads “book balance of your bank and cash accounts”.
- Lowest projected balance — the low point of the committed track across the whole horizon, including today’s opening balance. It turns red when it falls below your floor.
- Recent run-rate — your trailing-90-day net operating cash expressed per month, labelled net cash generated or net cash burned.
- Cash is projected to run low — a warning banner that appears when the committed balance dips below the floor, naming the floor and the date — the end of the first period that breaches it: “Collecting overdue invoices or deferring a bill would close the gap.”
- Forecast chart and table — the Forecast chart panel is open by default (Hide folds it away) and offers two charts you switch between with the buttons above the chart. Projected cash balance, shown first, draws one bar per period for the committed balance at the end of that period, in red wherever it falls below your floor. Money in vs out sets each period’s Expected in beside its Expected out, and appears only when at least one period has money moving. Both carry the same PNG, PDF, and Print buttons as the Dashboard charts. The run-rate track is not charted: you find it only in the table, which breaks each period into Expected in, Expected out (in parentheses), the running Committed balance — red in any period that sits below the floor — and With run-rate.
- Not counted — an amber panel below the table, present only when something was excluded: “Not counted: $X in receivables overdue by more than 90 days”, followed by each invoice, its due date, and how many days overdue it is. Raise the cut-off to include them, or chase them from the AR Aging report.
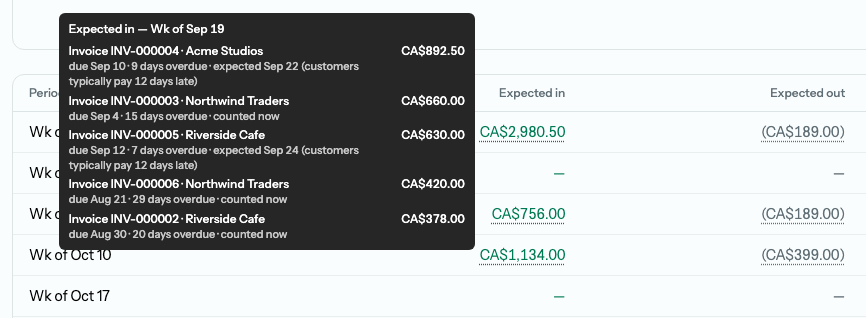
Every Expected in and Expected out figure is dotted-underlined. Hover it and a tooltip lists the documents that make up the number, largest first. Each invoice shows its due date, how many days overdue it is when it is late, and — when your customers typically pay late — the date it is now expected: “due Sep 14 · 5 days overdue · expected Sep 26 (customers typically pay 12 days late)”. An item whose expected date has already passed is marked “counted now” instead: every overdue bill, and an overdue invoice once the typical delay has run out as well. Each post-dated entry shows where it came from and the date it is booked. A period with more than twelve items lists its eleven largest and folds the rest into a twelfth row, such as “3 more items”, that carries their combined amount.
Note — An estimate, not a promise. The committed track only knows about documents already posted — it cannot see a sale you have not invoiced yet — and the run-rate is a simple 90-day average, so one unusual month can skew it. Treat the forecast as an early-warning signal: when it turns red, act on the specific invoices and bills the tooltips name. Both fixes — collecting an overdue invoice or moving a bill’s due date — change the underlying documents, and the forecast updates the moment you do.
Tip — Where the forecast lives. The forecast is one of the cash-focused reports under Reports → Company & Financial. The Reports page covers the rest of the reporting suite, including the historical Cash Flow statement that explains where cash already went.
Charts
Below the cards, the Dashboard draws a few charts straight from your posted books so you can read the trend without opening a report. They are always expanded — there is nothing to set up.
- Cash flow — the last six months as grouped bars, money in beside money out for each month. Each journal entry’s cash lines are netted first, so a transfer between two of your own accounts — Undeposited Funds to the bank on a deposit, say — does not inflate both bars.
- Income & expenses — your fiscal year to date with income, expenses, and the resulting net income side by side. It appears once there is activity in the year.
- Cash, receivables & payables — today’s cash on hand, what customers owe you, and what you owe vendors — the same three figures as the cards — so your liquidity is one glance away.
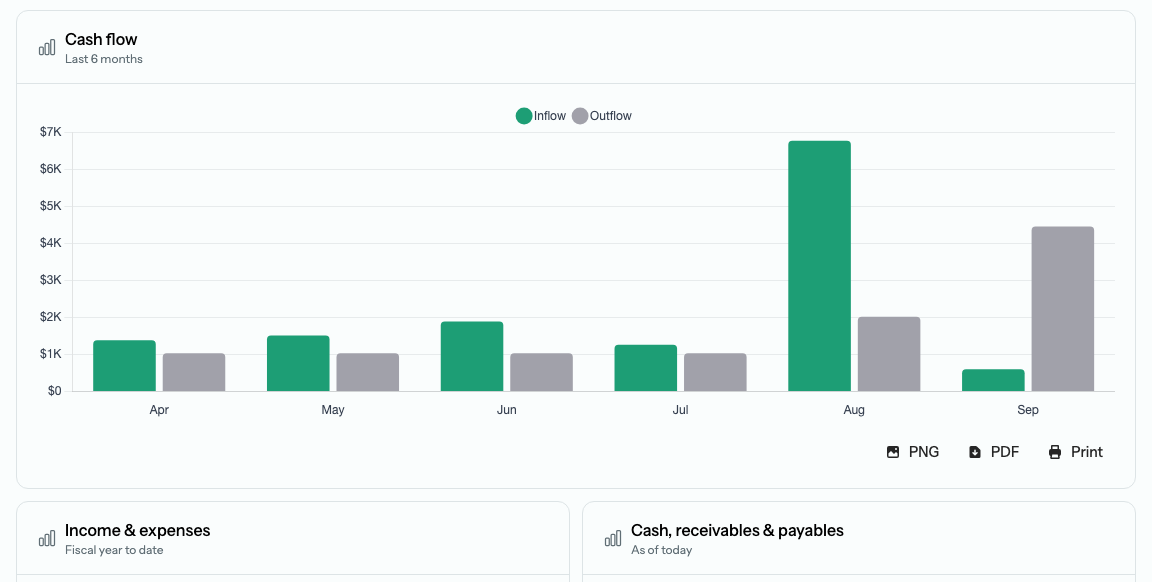
Tip — Export any chart. Every chart in the app — on the Dashboard, the financial statements, and the forecast — carries the same three buttons: PNG saves it as an image, PDF wraps it in a branded one-page report, and Print opens your browser’s print dialog. Handy for dropping a cash-flow chart into a board deck or emailing it to your accountant.
Recent transactions
At the bottom, a single feed lists the eight latest documents across the whole business — invoices, bills (including employee reimbursements), cheques, vendor payments, customer receipts, and deposits — newest first, each with its number, the customer or vendor (or the deposit’s memo), its date, and its amount. Drafts and voided documents are left out. Money coming in is marked with a green inbound arrow; money going out with a grey outbound arrow and a minus sign. Select any row to open the document it came from.
Setup helpers
A brand-new organization shows a couple of one-time helpers above the cards. Both are per organization, and both go away on their own once you are done with them.
- Finish setting up your company — if you started a QuickBooks import and did not finish, an amber banner offers a Continue import button. Dismiss it with the × and it stays hidden for good; you can still resume the import from the Import from QuickBooks page in the organization’s settings.
- Getting-started tips — a blue box that walks through a few short tips one at a time — customizing the sidebar, the bank register, and on an organization that tracks membership, such as Demo Community Society, the Members and Membership Levels pages — each with a button that opens the page in question. Tick Mark as done as you work through them; the box closes itself once every tip is checked. Close it early with the × and you can bring it back later from Settings → Organizations → your organization → Getting-started tips → Show tips.
The organization switcher
The switcher sits at the very top of the sidebar. Its button shows the organization you are in — the logo, or its initials, on a square in the organization’s branding colours, beside its display name — so it is obvious at a glance which set of books you are working in.
To open another organization:
- Select the switcher at the top of the sidebar. The menu, headed Organizations, lists every organization you belong to; the one you are in carries a check mark.
- Select any other organization — each carries a small open-in-new-tab arrow. It opens in a new browser tab on that organization’s Dashboard, and the tab you clicked in stays exactly where it was.
- Select New organization at the bottom of the menu to start the setup wizard for another set of books — see Create an organization.
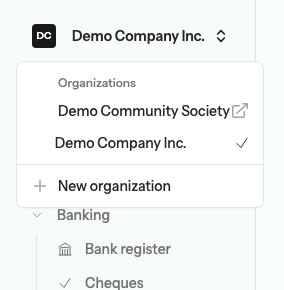
Tip — Two sets of books side by side. Because switching opens a new tab, you can keep Demo Company Inc. and Demo Community Society open at the same time and move between them with your browser’s tabs. Each tab carries its own organization in its address, so a link you copy from one always reopens the right set of books.
Tips
- Search everything — the Search… box at the top of the sidebar opens with ⌘K on a Mac or Ctrl+K elsewhere. Type at least two characters and results are grouped by kind: invoices, credit memos, bills, bill payments, receipts, cheques, deposits, journal entries, contacts, accounts, items, and tax returns. Select a result to open it — an account opens its General Ledger.
- Escape goes back — after drilling from a card into a report, press Escape to return to the Dashboard, exactly as the browser’s Back button would. If a dialog or menu is open, Escape closes that first. The behaviour is on by default and is your own choice: switch it off under Settings → Appearance → Escape goes back.
- The Dashboard is a launchpad — apart from closing the setup banner, the tips box, or the insight card, nothing you do here changes your books. Every action lands on the matching feature page, so you pick up exactly where the workflow expects you.
Reports tied to this area
- Cash on Hand — every bank and undeposited-funds account behind the Cash on hand card.
- Open Invoices — the invoices behind the Accounts receivable card, with their current balances.
- AP Aging — the bills behind the Accounts payable card, bucketed by how overdue they are.
- Income Statement — the income and expense detail behind the Net income (MTD) card.
- Cash Flow Forecast — where your cash is headed over the next 13 weeks or 6 months.