Insights is a small advisory layer on top of your books. Every night the app reads through each organization’s books looking for one thing worth telling you — an invoice that has gone overdue, a bill due this week, sales tax piling up, a record month — and writes it up as the day’s Daily insight. The card appears on the Dashboard; the Insights page keeps the history and adds a Financial health panel of fiscal-year-to-date figures. Nothing here posts anything: insights only read what you have already recorded. The examples below use Demo Company Inc.; the membership and donation examples come from Demo Community Society.
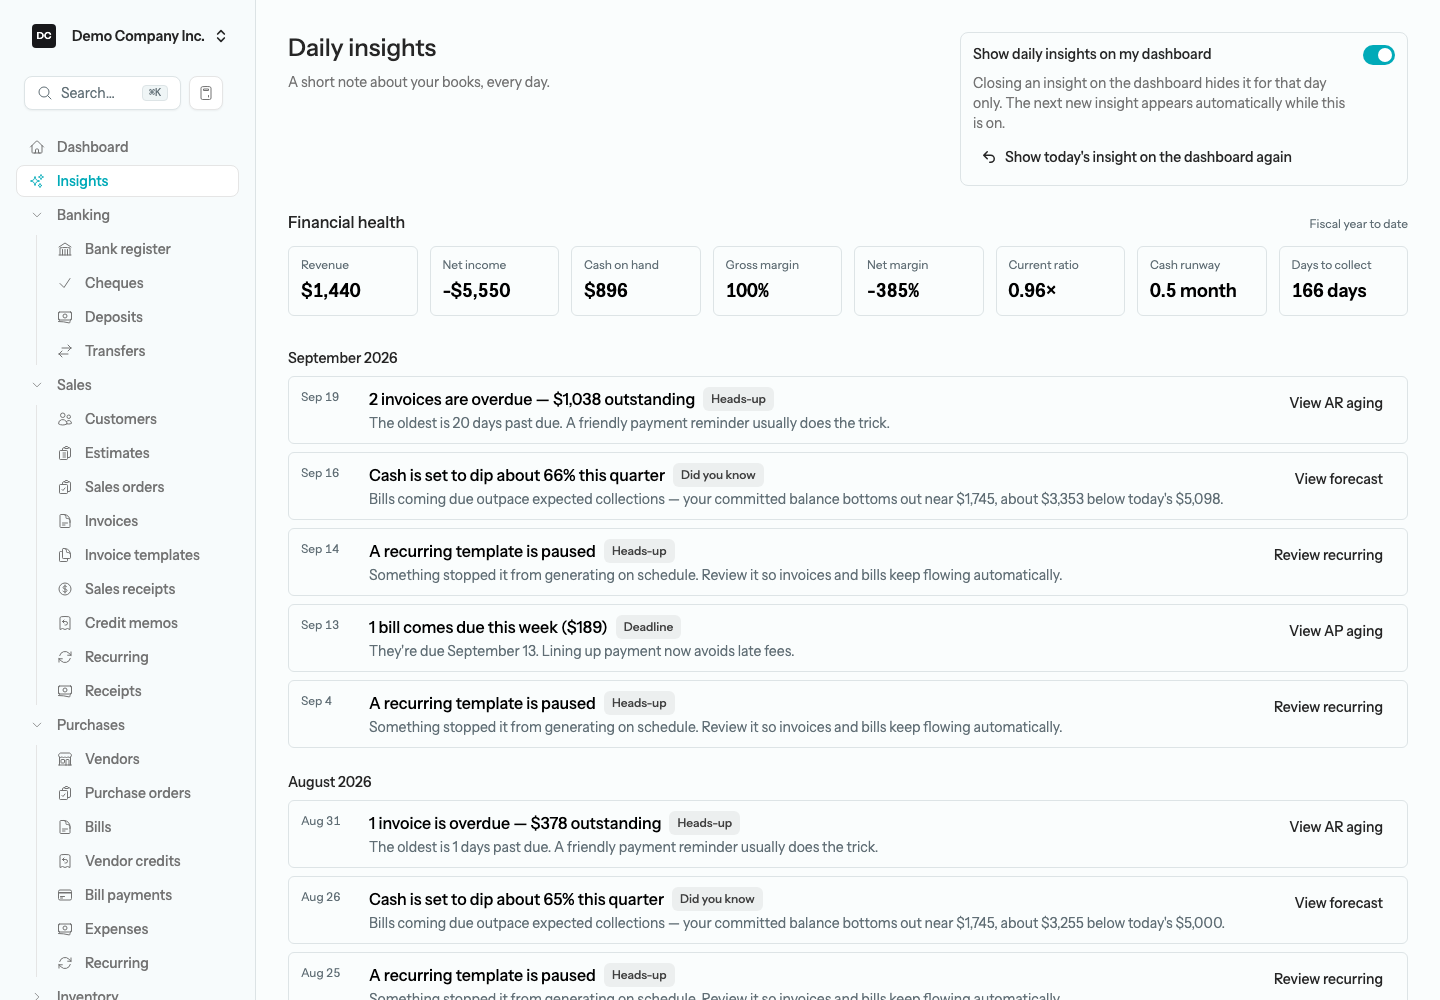
Open Insights from the sidebar — it sits directly under Dashboard at the top, in every organization. The page itself is titled Daily insights.
The daily insight
The Daily insight card sits near the top of the Dashboard, above the four summary cards. It shows a headline, a one- or two-sentence explanation, and usually a button that takes you to the page where you can act — View AR aging, View forecast, Open reconcile, and so on. A Past insights button opens the Insights page, and the × in the corner (Dismiss for today) closes the card on this browser for that day only: your colleagues still see it, and the next new insight reappears on its own.

When it is computed
Insights are never computed while you are looking at a page. A scheduled job, insights:generate, runs once a night at 05:00 server time and queues one small job per organization. Each job works out “today” in that organization’s time zone (the Timezone field on the organization’s edit page, Settings → Organizations → Edit organization), so the insight lands on your local calendar day, and it stores at most one insight per organization per day — running it twice changes nothing. The Dashboard card shows today’s insight, or yesterday’s if the morning run has not reached your time zone yet. On a quiet day — young books, nothing overdue, nothing due, no notable change — the job stores nothing and the card simply does not appear.
Note — Self-hosting. The nightly run comes from the scheduler, and the per-organization jobs run on the queue, so both must be running for insights to appear. The Self-hosting & upgrades page describes the queue worker and scheduler. The server settings that switch on AI wording (below) are environment variables, documented with the rest of them in the README that ships with LineLedger.
How the day’s insight is chosen
Each night the app runs seventeen detectors over your books. Every detector checks one condition and, when it is met, proposes a candidate with a score and a category: Deadline (something with a date attached), Heads-up (housekeeping your books need), or Did you know (a fact about how the organization is doing). The candidates are then ranked:
- Anti-repeat — a kind of insight is held back after it has been shown: 4 days for a Deadline, 10 days for a Heads-up, 21 days for a Did you know. Hard deadlines are exempt — a payroll remittance or a cash shortfall keeps coming back as its date nears.
- Variety — candidates in the same category as yesterday’s insight lose points, so you do not get three days of facts in a row.
- Rotation — a small, fixed weekly nudge per kind keeps quiet books from showing the same thing every time.
- Tie-break — when scores are equal, action beats trivia: Deadline first, then Heads-up, then Did you know.
The winner’s figures — counts, amounts, dates, percentages — are worked out that night and stored with the insight, so a row in the history never changes after the fact, even once you post more entries. The revenue, expense-category, cash-trend, and sales-tax insights read the posted general ledger; the two forecast insights use the Cash Flow Forecast engine; the rest read the records behind them — invoices still in Draft, imported bank statement lines, paused recurring templates, open bills and invoices, payments applied to invoices, customer balances, donation records, and pay runs and remittances.
What it can tell you
These are the kinds of insight the app can raise today, with the button each one carries. The wording adapts to the organization. Where an organization tracks membership, such as Demo Community Society, the receivables-concentration insight reads “One member holds …% of your receivables” instead of “One customer holds …”, the days-to-get-paid insight describes the invoices it averaged as “dues invoices” (it still counts every settled invoice, dues or not), and the overdue insight adds “Most are member dues” when at least half of the overdue invoices are dues. A non-profit’s revenue buttons open the Statement of Operations instead of the Income Statement.
- Deadline
- Bills due this week — open bills falling due within the next seven days, the same window the Dashboard’s Accounts payable card counts. View AP aging.
- Payroll remittance due — a CRA source-deduction due date is approaching, or has just passed, for a period that had payroll but no remittance recorded. Open PD7A report.
- Cash may run short around … — the committed cash forecast falls below zero within the next 13 weeks. View forecast.
- Heads-up
- Invoices overdue — at least one open invoice past its due date and at least $100 overdue in total; the body says how old the oldest is. View AR aging.
- Bank lines waiting to be matched — ten or more imported statement lines still Unmatched or Suggested. Open reconcile.
- Sales tax to set aside — tax collected has exceeded input credits by more than $500 since your last filed return. View sales tax report.
- Recurring templates paused — a recurring invoice, bill, or journal entry stopped generating on schedule. Review recurring.
- Draft invoices not sent — two or more invoices still in Draft whose invoice date is more than 14 days ago; a single old draft never raises it. Open invoices.
- Did you know
- Best revenue month — the month just ended set a record over up to 24 months of history; raised only in the first days of a new month. View income statement.
- Revenue pace — fiscal-year-to-date revenue is meaningfully ahead of, or behind, the same span of last year, once the year is at least 60 days old. View income statement.
- This month versus last year — month-to-date revenue against the same days of the same month last year. View income statement.
- Days to get paid — the average from invoice date to final receipt across invoices settled in the last 90 days, with a quarter-over-quarter comparison. View AR aging.
- Receivables concentration — one customer (or member) holds 40% or more of everything owed. View AR aging.
- Expense category shift — one expense account jumped sharply last month compared with the month before. View income statement.
- Cash trend — cash on hand moved meaningfully over the last 30 days; a drop scores higher than a rise. View cash flow.
- Cash is set to dip — the forecast stays positive but is projected to drop by at least $1,000 and at least 40% of today’s cash this quarter. View forecast.
- Donations this year — fiscal-year-to-date giving (total, number of gifts, distinct donors) for an organization with Fundraising turned on, such as Demo Community Society. View donations report.
Cash-flow forecast
The two cash insights — “Cash may run short around …” and “Cash is set to dip about …% this quarter” — come from the same engine as the Cash Flow Forecast report, and they never fire on the same day: the urgent runway alarm wins. Select View forecast to open Reports → Company & Financial → Cash Flow Forecast, where the period-by-period table shows exactly which invoices, bills, and post-dated entries drive the projection. The Reports page explains the forecast in full — its committed and with-run-rate tracks, the low-cash alert, and the doubtful-receivables cut-off.
The Insights page
Open Insights from the sidebar, or select Past insights on the Dashboard card. The page has three parts: a preference box at the top right, the Financial health panel, and the history of every insight the organization has received.
Financial health
The Financial health panel is a row of eight tiles labelled Fiscal year to date: every figure covers the period from the first day of your current fiscal year (the Fiscal year start month field on the organization’s edit page) through today, in your organization’s time zone. The numbers are recomputed from the posted ledger every time the page loads, using the same calculations as the Dashboard and the financial statements, so they always agree to the cent — nothing here is a stored snapshot.
- Revenue — total income for the fiscal year to date.
- Net income — revenue minus every expense, including cost of goods sold, for the fiscal year to date.
- Cash on hand — every bank and undeposited-funds balance as of today — the same total as the Dashboard’s Cash on hand card and the opening balance of the Cash Flow Forecast.
- Gross margin — gross profit (revenue minus cost of goods sold) as a percentage of revenue.
- Net margin — net income as a percentage of revenue.
- Current ratio — current assets (bank, accounts receivable, undeposited funds, inventory, and other current-asset accounts) divided by current liabilities (accounts payable, credit cards, tax payable, and other current-liability accounts), as of today. Above 1× means you could cover every short-term obligation from short-term assets.
- Cash runway — how many months today’s cash would last at your average monthly net loss over the last three calendar months (the current month so far included). It reads “Not burning cash” when income has kept up with expenses.
- Days to collect — days sales outstanding: accounts receivable as of today divided by fiscal-year-to-date revenue, scaled to the number of days in the period — roughly how long a customer takes to pay you.
Dollar tiles show whole dollars, the same house style as the Dashboard. A ratio shows an em dash (—) when there is nothing to divide by — no revenue yet for the margins, no current liabilities for the current ratio. The whole panel stays hidden until the organization has some revenue, cash, current assets, or current liabilities on the books.

Tip. Treat the panel as a quick read, not a substitute for the statements. For the numbers behind the tiles open the Income Statement and Balance Sheet under Reports; for the forward view, the Cash Flow Forecast.
Browse past insights
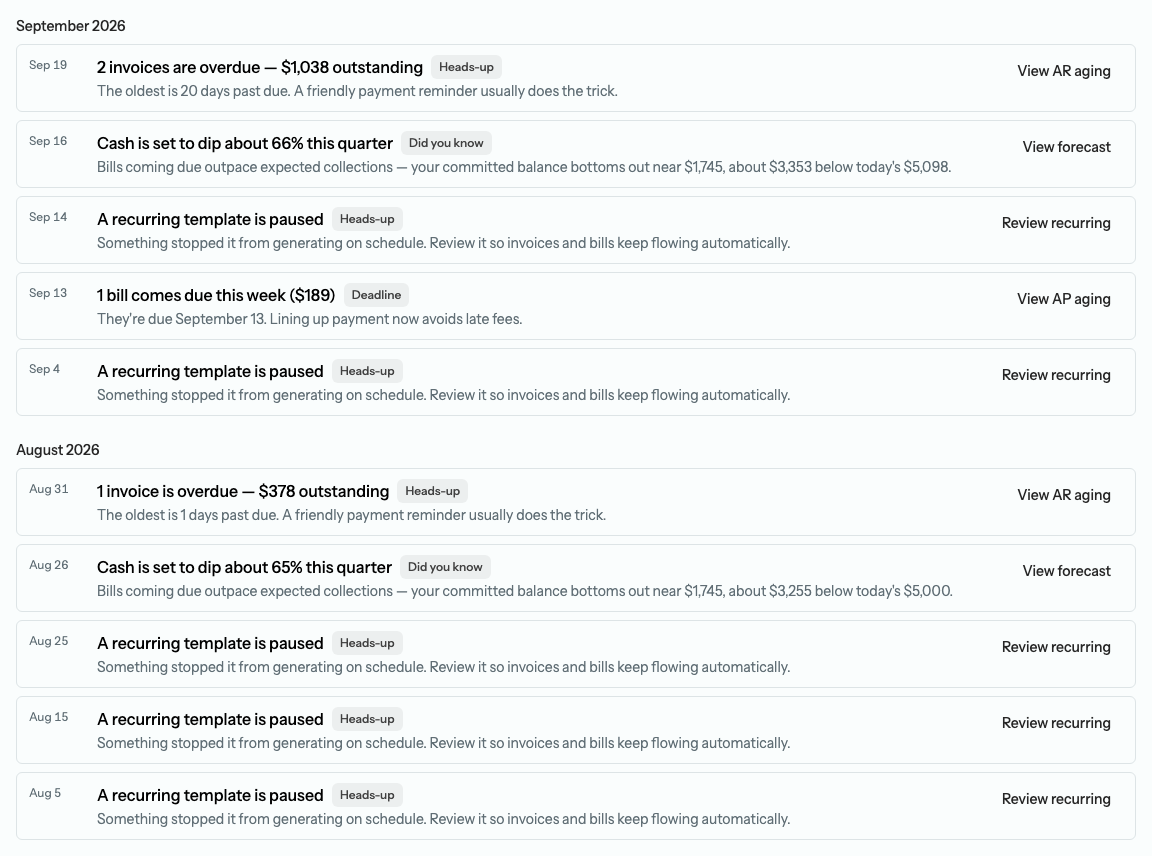
Below the panel, every insight the organization has received is listed newest first, grouped by month, 30 to a page. Each row shows the date, the headline, a category badge — Deadline, Heads-up, or Did you know — the explanation, and the same button the Dashboard card carried, so you can act on an older insight just as easily. A small sparkles icon marked Written with AI appears on rows whose wording came from the AI narrator (see below). A row for a kind of insight the app no longer raises keeps its text but shows no badge or button. Until the first nightly run stores something, the list reads “Insights will appear here once your books have a day of activity.”
Turn the dashboard card off for yourself
Closing the card with × hides one day’s insight on one browser. If you would rather not see the card at all, use the switch at the top of the Insights page: Show daily insights on my dashboard. It is a personal setting — it follows your login across every device and every organization you belong to, and it does not affect anyone else. Insights are still computed and still listed on this page while it is off.
To hide the card, or bring it back:
- Open Insights from the sidebar.
- Turn off Show daily insights on my dashboard. The change saves immediately and a message confirms: “Insights are hidden from your dashboard. You can still read them here.”
- Turn it back on at any time — “New insights will show on your dashboard.”
Closed today’s card by mistake? While the switch is on and there is a current insight, a “Show today’s insight on the dashboard again” button appears under it. Select it to clear the dismissal on this browser and go straight back to the Dashboard.
Let AI write the wording
By default every insight uses LineLedger’s own built-in wording — the sentences in the list above — and nothing leaves your server. Optionally, an organization can have the wording written by Claude, Anthropic’s AI model, which picks the most useful of the top-ranked candidates and phrases it in plain language. The figures never change: they are computed by the app before anything is sent, and the AI is only allowed to quote them.
The option is doubly opt-in, and off on both sides until someone acts. The site operator first enables it server-wide by setting INSIGHTS_AI_ENABLED=true and an Anthropic API key (ANTHROPIC_API_KEY) in the server’s environment, as described in the README that ships with LineLedger; only then does the switch appear on the organization’s edit page. Then an Owner or Admin turns it on for the organization.
To have AI write your organization’s daily insight:
- Open Settings → Organizations and select the pencil button (Edit organization) at the end of your organization’s row.
- Scroll to the Daily insight box and turn on Write my daily insight with AI. The switch saves on its own — “Daily insight preference saved.” — with no Save button needed.
- From the next nightly run, the Dashboard card carries an AI badge and history rows show the sparkles icon.
Note — What leaves the server. With the switch on, the nightly job sends Anthropic: today’s date; the organization’s type, whether it is a non-profit, whether it tracks membership, and its home currency; for up to three top-ranked candidates, the kind, the category, the pre-formatted figures (whole-dollar amounts, counts, dates, percentages) and the built-in reference wording; and the date, kind, and headline of the last seven insights, so the phrasing varies. It never sends customer, vendor, member, donor, or employee names, transaction descriptions or memos, or individual ledger lines. Two named things can be included: an expense account’s own name — a chart-of-accounts category, never a payee — when the expense-category insight is a candidate, and the tax agency’s name, such as Canada Revenue Agency, when the sales-tax insight is a candidate. Exact cents stay home; only rounded display values cross the wire. If the request fails, times out, picks something it was not offered, or quotes a dollar amount it was not given, the app discards the response and uses the built-in wording instead, so you never see a gap.
Who can see insights
Insights show the same class of aggregate figures as the Dashboard, so they follow the same rule: every member of the organization can see the Daily insight card, the Insights page, and the Financial health panel, whatever their role or section access — a Custom member limited to, say, Customers still sees them. The buttons on an insight are a different matter: they open ordinary pages, so a member without access to Banking or Reports is stopped at the page itself. Only an Owner or Admin can change the Write my daily insight with AI switch, and the Show daily insights on my dashboard switch is personal to each user. Roles and section access are described on the Settings page.
Reports tied to this area
- Cash Flow Forecast — the engine behind the two cash insights; View forecast opens it.
- AR Aging and AP Aging — behind the overdue-invoice, days-to-get-paid, receivables-concentration, and bills-due insights.
- Cash Flow — where a 30-day change in cash went.
- Sales Tax — the balance the sales-tax insight asks you to set aside.
- PD7A — the payroll remittance figures behind the remittance-due insight.
- Income Statement (Statement of Operations for a non-profit) and Balance Sheet — the statements behind the Financial health tiles and the revenue insights.
- Donations by Donor — behind the donations insight for organizations with Fundraising turned on.
All of them are described on the Reports page.